Supported by Dr. Osamu Ogasawara and  . . |
|
Last data update: 2014.03.03 |
CollegePlaying tableDescriptionInformation on schools players attended, by player Usagedata(CollegePlaying) FormatA data frame with 17350 observations on the following 3 variables.
DetailsThis data set reflects a change in the Lahman schema for the 2015 version.
The old According to the documentation, this change reflects advances in the compilation of this data, largely led by Ted Turocy. The old table reported college attendance for major league players by listing a start date and end date. The new version has a separate record for each year that a player attended. This allows us to better account for players who attended multiple colleges or skipped a season, as well as to identify teammates. SourceLahman, S. (2015) Lahman's Baseball Database, 1871-2014, 2015 version, http://baseball1.com/statistics/ Examples
data(CollegePlaying)
head(CollegePlaying)
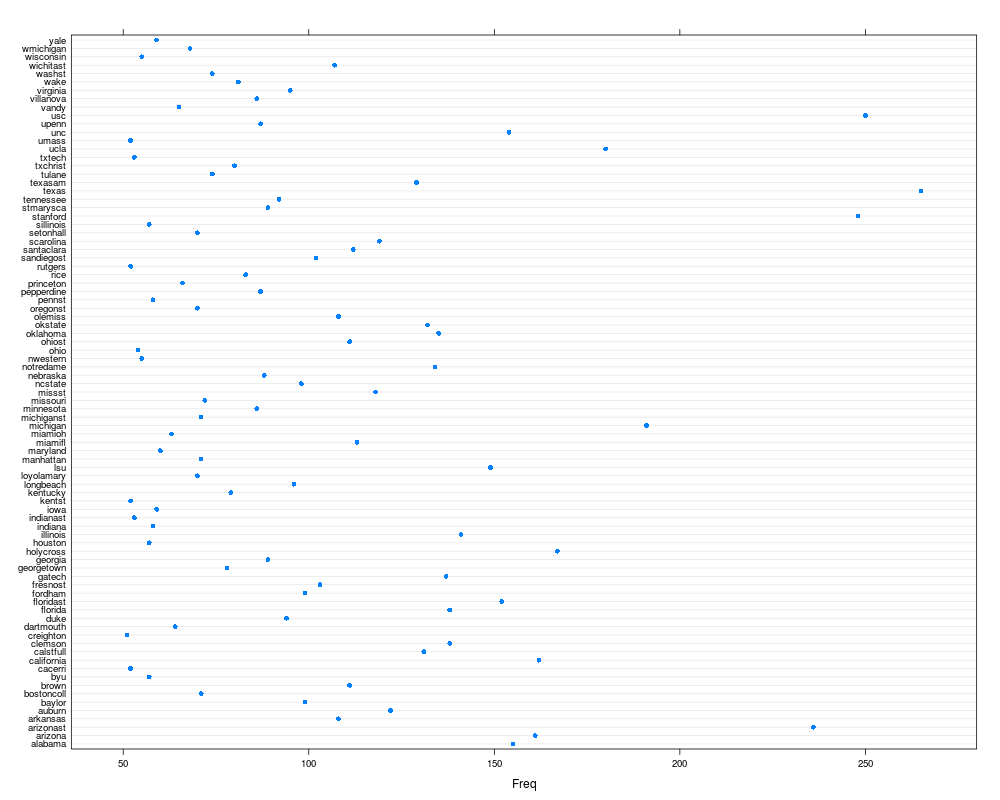
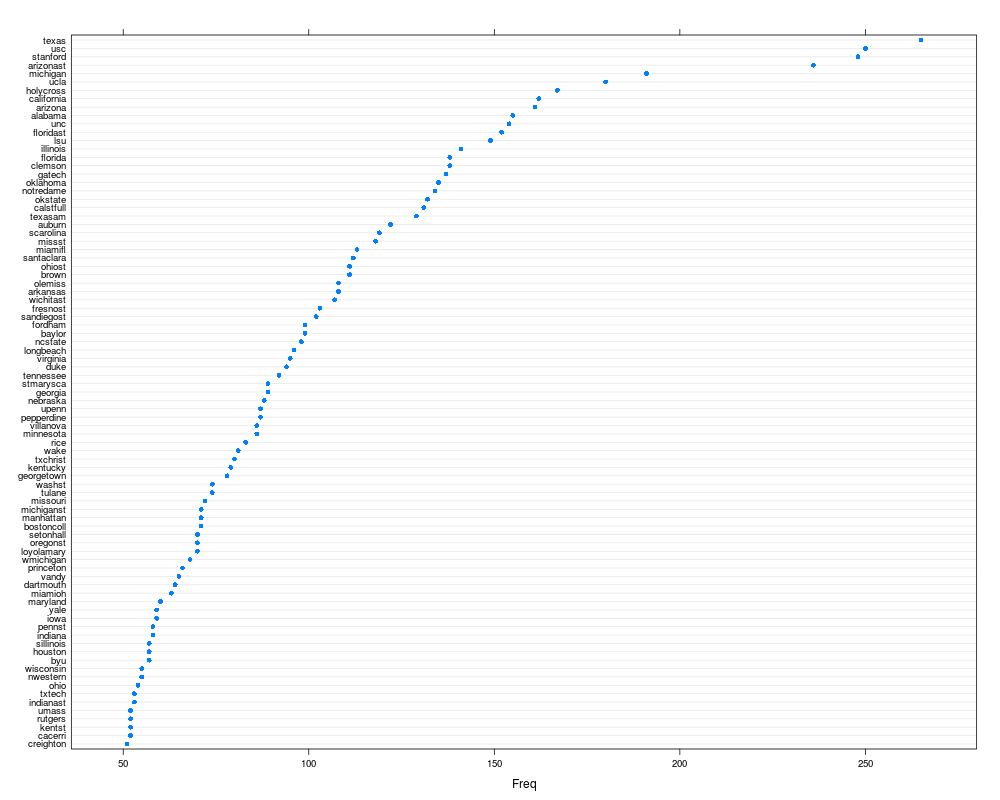
## Q: What are the top universities for producing MLB players?
SPcount <- table(CollegePlaying$schoolID)
SPcount[SPcount>50]
library('lattice')
dotplot(SPcount[SPcount>50])
dotplot(sort(SPcount[SPcount>50]))
## Q: How many schools are represented in this dataset?
length(table(CollegePlaying$schoolID))
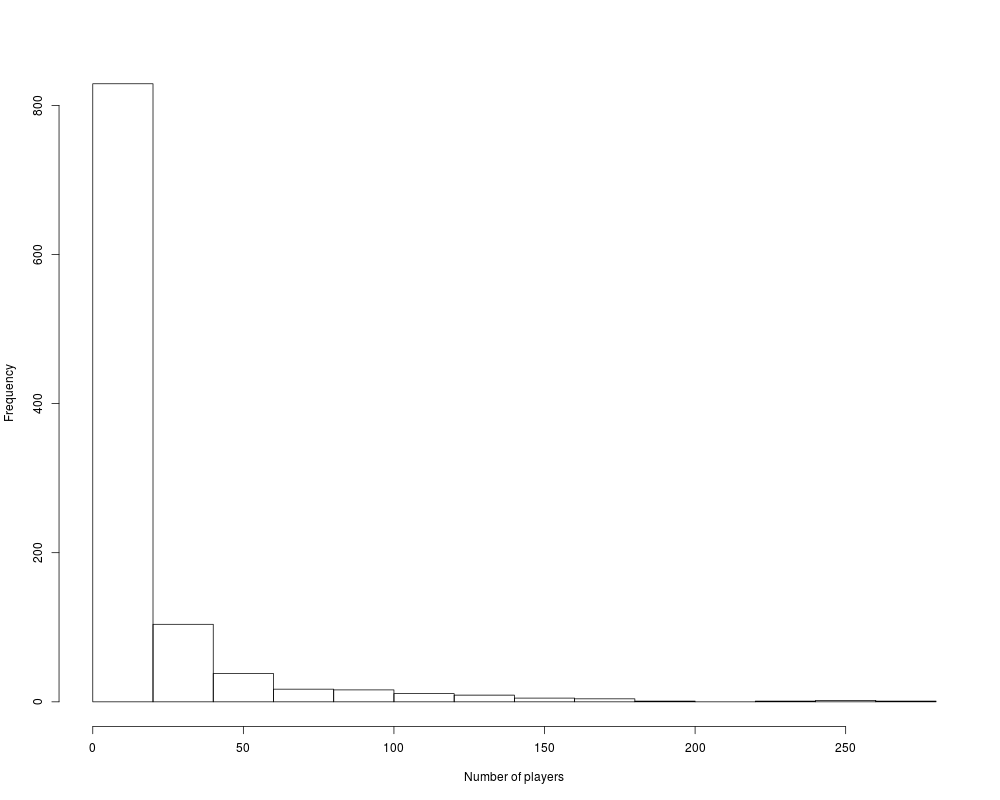
# Histogram of the number of players from each school who played in MLB:
with(CollegePlaying, hist(table(schoolID), xlab = 'Number of players',
main = ""))
Results
R version 3.3.1 (2016-06-21) -- "Bug in Your Hair"
Copyright (C) 2016 The R Foundation for Statistical Computing
Platform: x86_64-pc-linux-gnu (64-bit)

R is free software and comes with ABSOLUTELY NO WARRANTY.
You are welcome to redistribute it under certain conditions.
Type 'license()' or 'licence()' for distribution details.

R is a collaborative project with many contributors.
Type 'contributors()' for more information and
'citation()' on how to cite R or R packages in publications.

Type 'demo()' for some demos, 'help()' for on-line help, or
'help.start()' for an HTML browser interface to help.
Type 'q()' to quit R.

> library(Lahman)
> png(filename="/home/ddbj/snapshot/RGM3/R_CC/result/Lahman/CollegePlaying.Rd_%03d_medium.png", width=480, height=480)
> ### Name: CollegePlaying
> ### Title: CollegePlaying table
> ### Aliases: CollegePlaying
> ### Keywords: datasets
>
> ### ** Examples
>
> data(CollegePlaying)
> head(CollegePlaying)
   playerID schoolID yearID
1 aardsda01   pennst   2001
2 aardsda01     rice   2002
3 aardsda01     rice   2003
4  abadan01  gamiddl   1992
5  abadan01  gamiddl   1993
6 abbeybe01  vermont   1889
>
> ## Q: What are the top universities for producing MLB players?
> SPcount <- table(CollegePlaying$schoolID)
> SPcount[SPcount>50]

   alabama    arizona  arizonast   arkansas     auburn     baylor bostoncoll
       155        161        236        108        122         99         71
     brown        byu    cacerri california  calstfull    clemson  creighton
       111         57         52        162        131        138         51
 dartmouth       duke    florida  floridast    fordham   fresnost     gatech
        64         94        138        152         99        103        137
georgetown    georgia  holycross    houston   illinois    indiana  indianast
        78         89        167         57        141         58         53
      iowa     kentst   kentucky  longbeach loyolamary        lsu  manhattan
        59         52         79         96         70        149         71
  maryland    miamifl    miamioh   michigan michiganst  minnesota   missouri
        60        113         63        191         71         86         72
    missst    ncstate   nebraska  notredame   nwestern       ohio     ohiost
       118         98         88        134         55         54        111
  oklahoma    okstate    olemiss   oregonst     pennst pepperdine  princeton
       135        132        108         70         58         87         66
      rice    rutgers sandiegost santaclara  scarolina  setonhall  sillinois
        83         52        102        112        119         70         57
  stanford  stmarysca  tennessee      texas    texasam     tulane   txchrist
       248         89         92        265        129         74         80
    txtech       ucla      umass        unc      upenn        usc      vandy
        53        180         52        154         87        250         65
 villanova   virginia       wake     washst  wichitast  wisconsin  wmichigan
        86         95         81         74        107         55         68
      yale
        59
>
> library('lattice')
> dotplot(SPcount[SPcount>50])
> dotplot(sort(SPcount[SPcount>50]))
>
> ## Q: How many schools are represented in this dataset?
> length(table(CollegePlaying$schoolID))
[1] 1038
>
> # Histogram of the number of players from each school who played in MLB:
> with(CollegePlaying, hist(table(schoolID), xlab = 'Number of players',
+                            main = ""))
>
>
>
>
>
> dev.off()
null device
          1
>
|