Supported by Dr. Osamu Ogasawara and  . . |
|
Last data update: 2014.03.03 |
Teams tableDescriptionYearly statistics and standings for teams Usagedata(Teams) FormatA data frame with 2775 observations on the following 48 variables.
DetailsVariables SourceLahman, S. (2015) Lahman's Baseball Database, 1871-2014, 2015 version, http://baseball1.com/statistics/ Examples
data(Teams)
# subset on a few variables
teams <- subset(Teams, lgID %in% c("AL", "NL"))
teams <- subset(teams, yearID>1900)
# drop some variables
teams <- subset(teams, select=-c(Ghome,divID,DivWin:WSWin,name,park,teamIDBR:teamIDretro))
teams <- subset(teams, select=-c(HBP,CS,BPF,PPF))
# subset to remove infrequent teams
tcount <- table(teams$teamID)
teams <- subset(teams, teams$teamID %in% names(tcount)[tcount>15], drop=TRUE)
teams$teamID <- factor(teams$teamID, levels=names(tcount)[tcount>15])
# relevel lgID
teams$lgID <- factor(teams$lgID, levels= c("AL", "NL"))
# create new variables
teams <- within(teams, {
WinPct = W / G ## Winning percentage
})
library(lattice)
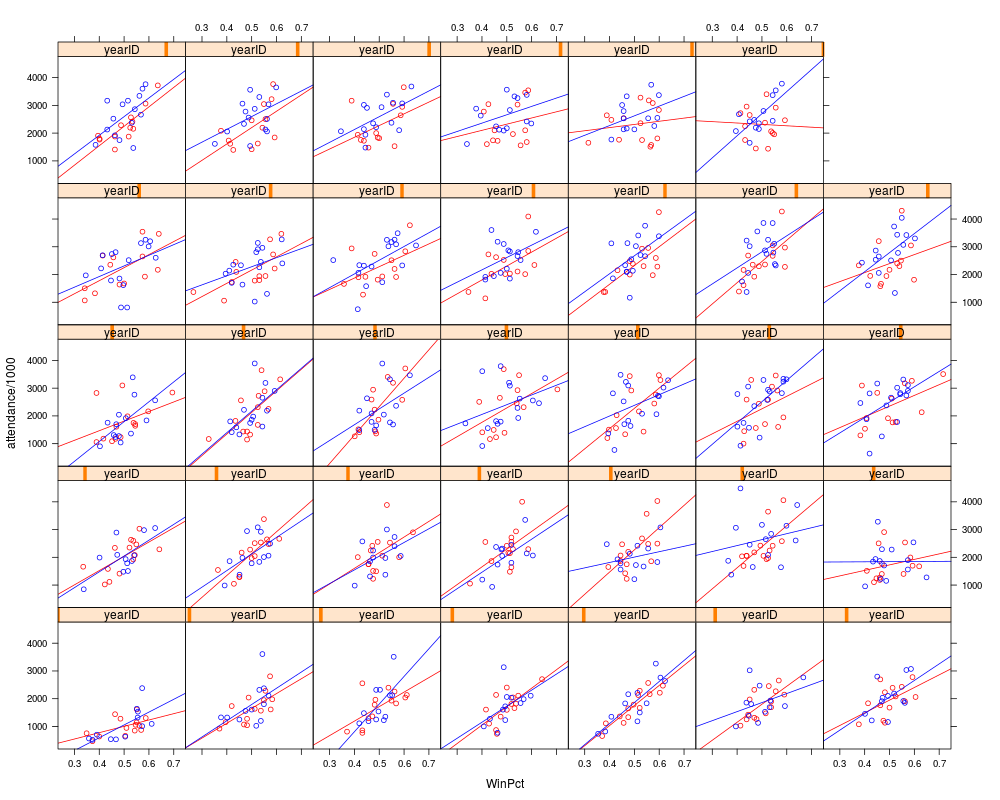
xyplot(attendance/1000 ~ WinPct|yearID, groups=lgID, data=subset(teams, yearID>1980),
type=c("p", "r"), col=c("red","blue"))
## Not run:
if(require(googleVis)) {
motion1 <- gvisMotionChart(teams, idvar='teamID', timevar='yearID',
chartid="gvisTeams", options=list(width=700, height=600))
plot(motion1)
#print(motion1, file="gvisTeams.html")
#### merge with ave salary, for those years where salary is available
avesal <- aggregate(salary ~ yearID + teamID, data=Salaries, FUN=mean)
# salary data just starts after 1980
teamsSal <- subset(teams, yearID>=1980)
# add salary to team data
teamsSal <- merge(teamsSal,
avesal[,c("yearID", "teamID", "salary")],
by=c("yearID", "teamID"), all.x=TRUE)
motion2 <- gvisMotionChart(teamsSal, idvar='teamID', timevar='yearID',
xvar="attendance", yvar="salary", sizevar="WinPct",
chartid="gvisTeamsSal", options=list(width=700, height=600))
plot(motion2)
#print(motion2, file="gvisTeamsSal.html")
}
## End(Not run)
Results
R version 3.3.1 (2016-06-21) -- "Bug in Your Hair"
Copyright (C) 2016 The R Foundation for Statistical Computing
Platform: x86_64-pc-linux-gnu (64-bit)

R is free software and comes with ABSOLUTELY NO WARRANTY.
You are welcome to redistribute it under certain conditions.
Type 'license()' or 'licence()' for distribution details.

R is a collaborative project with many contributors.
Type 'contributors()' for more information and
'citation()' on how to cite R or R packages in publications.

Type 'demo()' for some demos, 'help()' for on-line help, or
'help.start()' for an HTML browser interface to help.
Type 'q()' to quit R.

> library(Lahman)
> png(filename="/home/ddbj/snapshot/RGM3/R_CC/result/Lahman/Teams.Rd_%03d_medium.png", width=480, height=480)
> ### Name: Teams
> ### Title: Teams table
> ### Aliases: Teams
> ### Keywords: datasets
>
> ### ** Examples
>
> data(Teams)
>
> # subset on a few variables
> teams <- subset(Teams, lgID %in% c("AL", "NL"))
> teams <- subset(teams, yearID>1900)
> # drop some variables
> teams <- subset(teams, select=-c(Ghome,divID,DivWin:WSWin,name,park,teamIDBR:teamIDretro))
> teams <- subset(teams, select=-c(HBP,CS,BPF,PPF))
>
> # subset to remove infrequent teams
> tcount <- table(teams$teamID)
> teams <- subset(teams, teams$teamID %in% names(tcount)[tcount>15], drop=TRUE)
> teams$teamID <- factor(teams$teamID, levels=names(tcount)[tcount>15])
>
> # relevel lgID
> teams$lgID <- factor(teams$lgID, levels= c("AL", "NL"))
> # create new variables
>
> teams <- within(teams, {
+    WinPct = W / G    ## Winning percentage
+    })
>
> library(lattice)
> xyplot(attendance/1000 ~ WinPct|yearID, groups=lgID, data=subset(teams, yearID>1980),
+ 	type=c("p", "r"), col=c("red","blue"))
>
> ## Not run:
> ##D if(require(googleVis)) {
> ##D motion1 <- gvisMotionChart(teams, idvar='teamID', timevar='yearID',
> ##D 	chartid="gvisTeams", options=list(width=700, height=600))
> ##D plot(motion1)
> ##D #print(motion1, file="gvisTeams.html")
> ##D
> ##D #### merge with ave salary, for those years where salary is available
> ##D
> ##D avesal <- aggregate(salary ~ yearID + teamID, data=Salaries, FUN=mean)
> ##D
> ##D # salary data just starts after 1980
> ##D teamsSal <- subset(teams, yearID>=1980)
> ##D
> ##D # add salary to team data
> ##D teamsSal <- merge(teamsSal,
> ##D                  avesal[,c("yearID", "teamID", "salary")],
> ##D                  by=c("yearID", "teamID"), all.x=TRUE)
> ##D
> ##D motion2 <- gvisMotionChart(teamsSal, idvar='teamID', timevar='yearID',
> ##D   xvar="attendance", yvar="salary", sizevar="WinPct",
> ##D 	chartid="gvisTeamsSal", options=list(width=700, height=600))
> ##D plot(motion2)
> ##D #print(motion2, file="gvisTeamsSal.html")
> ##D
> ##D }
> ## End(Not run)
>
>
>
>
>
> dev.off()
null device
          1
>
|