Supported by Dr. Osamu Ogasawara and  . . |
|
Last data update: 2014.03.03 |
Generate a 1D Langevin processDescription
Usagetimeseries1D(N, startpoint = 0, d13 = 0, d12 = 0, d11 = -1, d10 = 0, d22 = 0, d21 = 0, d20 = 1, sf = 1000, dt = 0) Arguments
Value
Author(s)Philip Rinn See Also
Examples
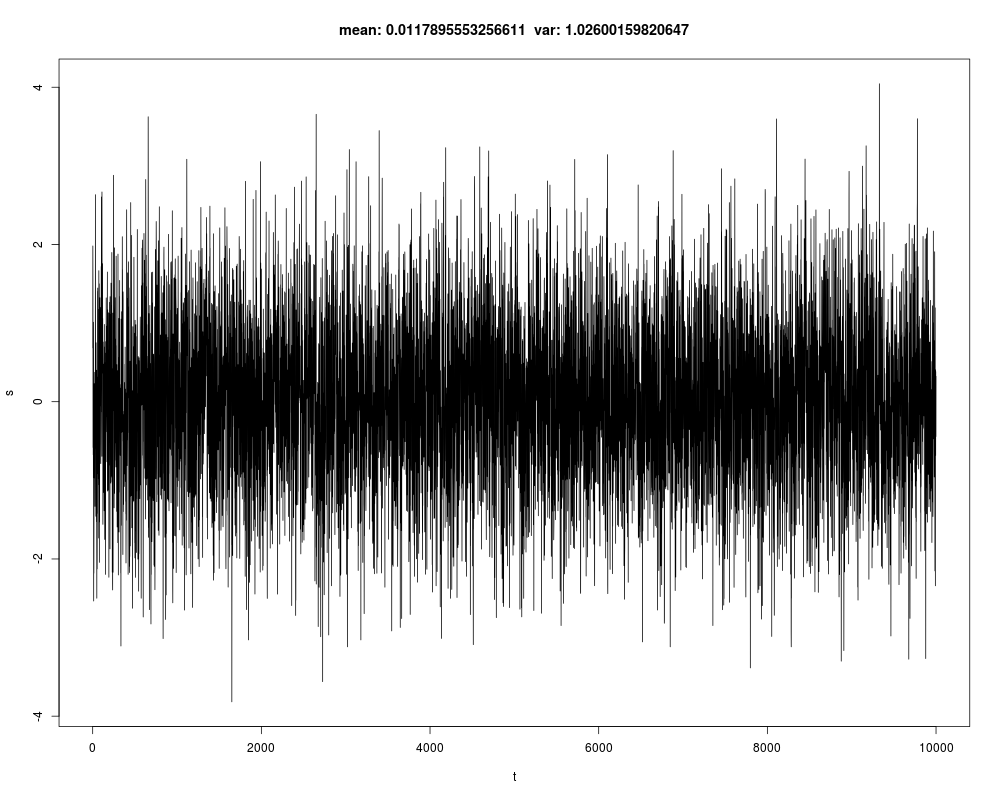
# Generate standardized Ornstein-Uhlenbeck-Process (d11=-1, d20=1)
# with integration time step 0.01 and sampling frequency 1
s <- timeseries1D(N=1e4, sf=1, dt=0.01);
t <- 1:1e4;
plot(t, s, t="l", main=paste("mean:", mean(s), " var:", var(s)));
Results
R version 3.3.1 (2016-06-21) -- "Bug in Your Hair"
Copyright (C) 2016 The R Foundation for Statistical Computing
Platform: x86_64-pc-linux-gnu (64-bit)

R is free software and comes with ABSOLUTELY NO WARRANTY.
You are welcome to redistribute it under certain conditions.
Type 'license()' or 'licence()' for distribution details.

R is a collaborative project with many contributors.
Type 'contributors()' for more information and
'citation()' on how to cite R or R packages in publications.

Type 'demo()' for some demos, 'help()' for on-line help, or
'help.start()' for an HTML browser interface to help.
Type 'q()' to quit R.

> library(Langevin)
> png(filename="/home/ddbj/snapshot/RGM3/R_CC/result/Langevin/timeseries1D.Rd_%03d_medium.png", width=480, height=480)
> ### Name: timeseries1D
> ### Title: Generate a 1D Langevin process
> ### Aliases: timeseries1D
>
> ### ** Examples
>
> # Generate standardized Ornstein-Uhlenbeck-Process (d11=-1, d20=1)
> # with integration time step 0.01 and sampling frequency 1
> s <- timeseries1D(N=1e4, sf=1, dt=0.01);
> t <- 1:1e4;
> plot(t, s, t="l", main=paste("mean:", mean(s), " var:", var(s)));
>
>
>
>
>
> dev.off()
null device
          1
>
|
Created & Maintained by Osamu Ogasawara (osamu.ogasawara@gmail.com) and 