Supported by Dr. Osamu Ogasawara and  . . |
|
Last data update: 2014.03.03 |
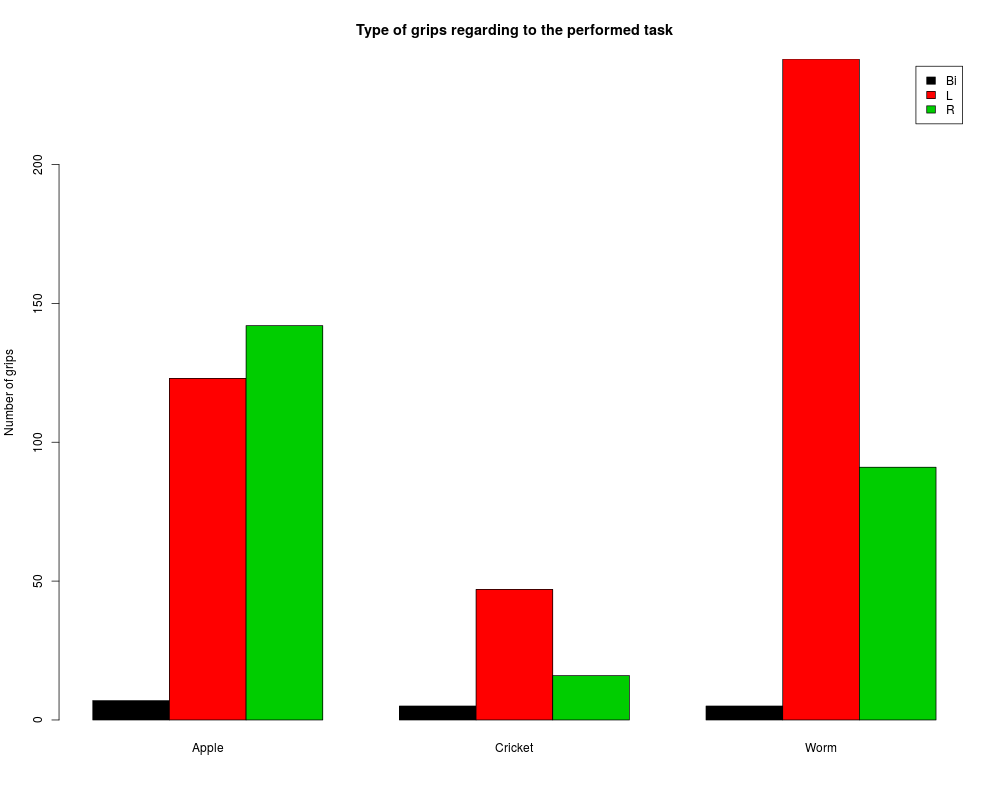
laterhist: this function plots an histogram of the different type of grasp (Left, right, bimanual...) for each kind of activity.DescriptionCounts the number of occurences of each type of grasp and plot the corresponding histogram for each task performed. Usagelaterhist(data, catch = "Food", hand = "Hand", col = 1:nlevels(data[[hand]]), ylim = NULL, ylab = "Number of grips", main = "Type of grips regarding to the performed task", legend.text = FALSE, beside = TRUE, legendlocation = TRUE, cex = 1, pt.cex = 2, pch = 15) Arguments
Author(s)Borel A., Pouydebat E., Reghem E. <antony.borel@gmail.com> ReferencesMeguerditchian A., Calcutt S.E., Lonsdorf E.V., Ross S.R. and Hopkins W.D. (2010) Brief communication: Captive Gorillas are right-handed for bimanual feeding. American Journal of Physical Anthropology 141:638-645. See Also
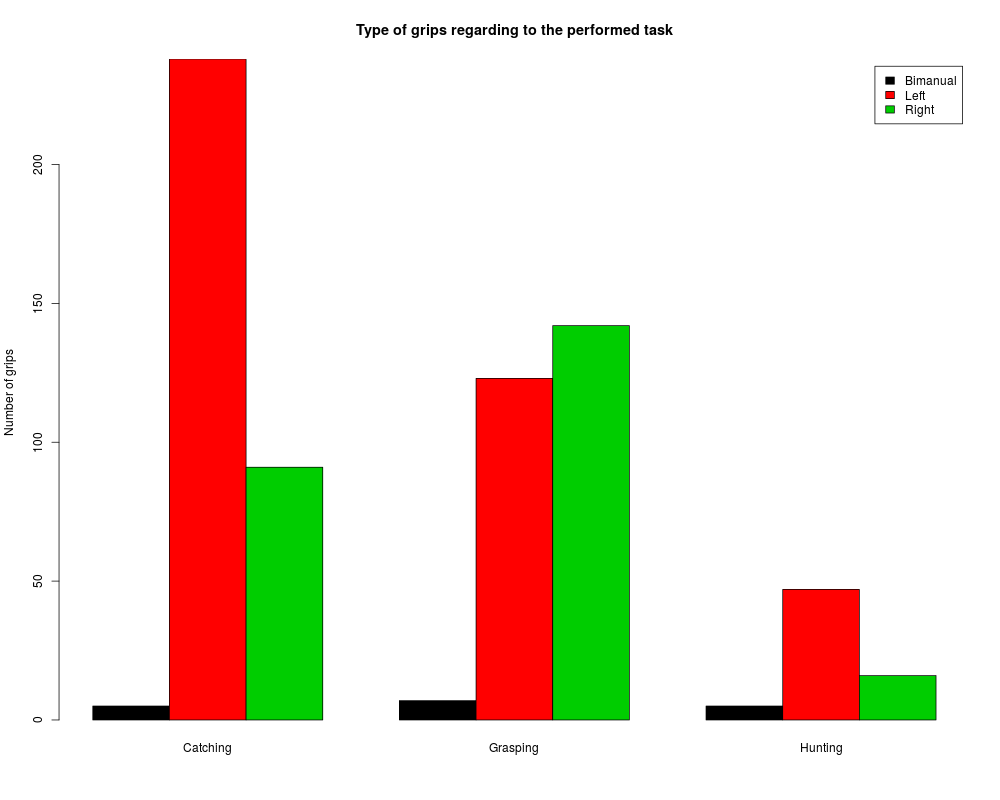
Examples## With arguments corresponding to the default ones: data(laterdata) str(laterdata) Data<-laterdata laterhist(Data, catch ="Food", hand="Hand", legend.text = TRUE, legendlocation = FALSE) ## or laterhist(Data, legend.text = TRUE, legendlocation = FALSE) ## With arguments different from the default ones: data(lateradata) str(lateradata) Data<-lateradata laterhist(Data, catch ="Act", hand="HandPref", legend.text = TRUE, legendlocation = FALSE) Results
R version 3.3.1 (2016-06-21) -- "Bug in Your Hair"
Copyright (C) 2016 The R Foundation for Statistical Computing
Platform: x86_64-pc-linux-gnu (64-bit)

R is free software and comes with ABSOLUTELY NO WARRANTY.
You are welcome to redistribute it under certain conditions.
Type 'license()' or 'licence()' for distribution details.

R is a collaborative project with many contributors.
Type 'contributors()' for more information and
'citation()' on how to cite R or R packages in publications.

Type 'demo()' for some demos, 'help()' for on-line help, or
'help.start()' for an HTML browser interface to help.
Type 'q()' to quit R.

> library(Laterality)
> png(filename="/home/ddbj/snapshot/RGM3/R_CC/result/Laterality/laterhist.Rd_%03d_medium.png", width=480, height=480)
> ### Name: laterhist
> ### Title: laterhist: this function plots an histogram of the different
> ###   type of grasp (Left, right, bimanual...) for each kind of activity.
> ### Aliases: laterhist
> ### Keywords: HI handedness index zscore laterality manual preference
>
> ### ** Examples
>
>   ## With arguments corresponding to the default ones:
>   data(laterdata)
>   str(laterdata)
'data.frame':	674 obs. of  5 variables:
 $ Indiv      : Factor w/ 11 levels "Airly","Biwa",..: 11 9 6 8 3 11 9 6 11 10 ...
 $ Sex        : Factor w/ 2 levels "f","m": 2 2 1 1 1 2 2 1 2 1 ...
 $ Food       : Factor w/ 3 levels "Apple","Cricket",..: 1 1 1 1 1 1 1 1 1 1 ...
 $ Hand       : Factor w/ 3 levels "Bi","L","R": 3 3 1 2 2 1 3 3 3 3 ...
 $ PostureCorp: Factor w/ 7 levels "A","Bip","BipGrill",..: 6 7 2 7 6 1 6 6 6 6 ...
>   Data<-laterdata
>   laterhist(Data, catch ="Food", hand="Hand",
+   legend.text = TRUE, legendlocation = FALSE)
NULL
>   ## or
>   laterhist(Data, legend.text = TRUE, legendlocation = FALSE)
NULL
>
>   ## With arguments different from the default ones:
>   data(lateradata)
>   str(lateradata)
'data.frame':	674 obs. of  5 variables:
 $ Individual : Factor w/ 11 levels "Airly","Biwa",..: 11 9 6 8 3 11 9 6 11 10 ...
 $ Sex        : Factor w/ 2 levels "f","m": 2 2 1 1 1 2 2 1 2 1 ...
 $ Act        : Factor w/ 3 levels "Catching","Grasping",..: 2 2 2 2 2 2 2 2 2 2 ...
 $ HandPref   : Factor w/ 3 levels "Bimanual","Left",..: 3 3 1 2 2 1 3 3 3 3 ...
 $ PostureCorp: Factor w/ 7 levels "A","Bip","BipGrill",..: 6 7 2 7 6 1 6 6 6 6 ...
>   Data<-lateradata
>   laterhist(Data, catch ="Act", hand="HandPref", legend.text = TRUE, legendlocation = FALSE)
NULL
>
>
>
>
>
> dev.off()
null device
          1
>
|