Supported by Dr. Osamu Ogasawara and  . . |
|
Last data update: 2014.03.03 |
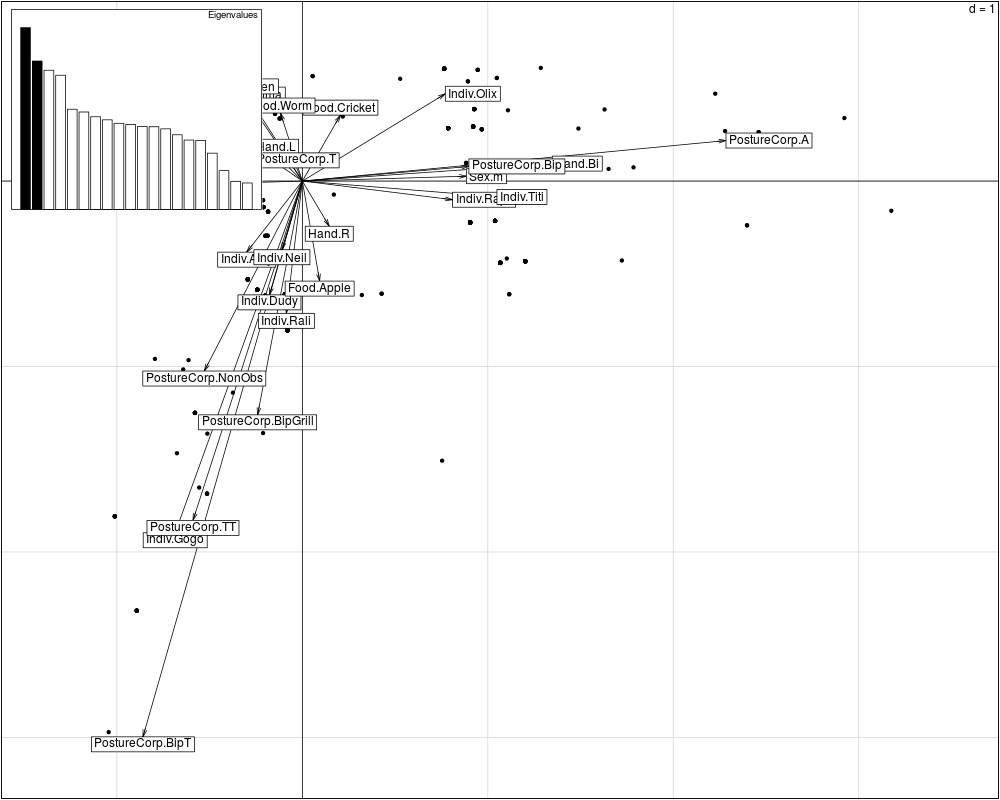
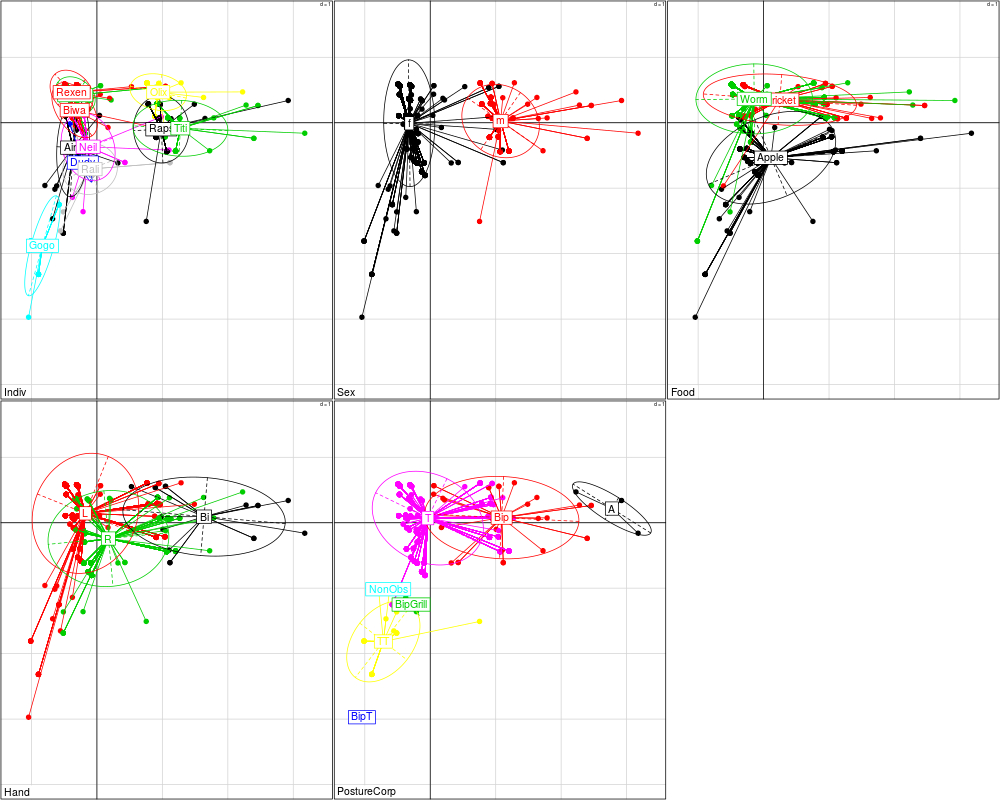
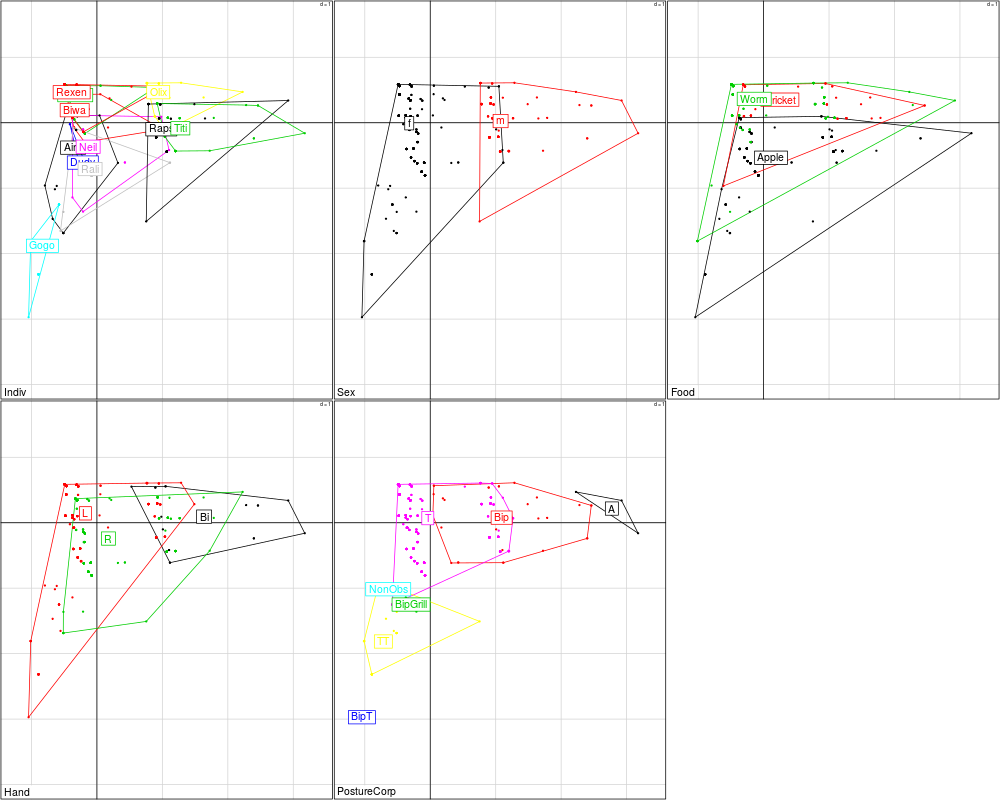
visAFCM: this function plots multiple correspondence analysis graphs based on ade4 package functions.DescriptionPlots multiple correspondence analysis graphs. The graphs can be unique or multiple which is sometimes necessary for better lisibility. UsagevisAFCM(data, scannf=FALSE, nf=2, xax = 1, yax = 2, clab.row = FALSE, clab.col = 1, permute = FALSE, posieig = "top", sub = NULL, graphstyle = "unique", graphrow = 1, graphcol = 3, cpoint = 1, clabel = 2, csub = 2) Arguments
NoteIf you use this function please cite also ade4-package. Author(s)Borel A., Pouydebat E., Reghem E. <antony.borel@gmail.com> based on functions from Daniel Chessel, Anne-Beatrice Dufour and Stephane Dray, with contributions from Thibaut Jombart, Jean R. Lobry, Sebastien Ollier, Sandrine Pavoine and Jean Thioulouse. Package ade4: Analysis of Ecological Data : Exploratory and Euclidean methods in Environmental sciences. ReferencesDaniel Chessel, Anne-Beatrice Dufour and Stephane Dray, with contributions from Thibaut Jombart, Jean R. Lobry, Sebastien Ollier, Sandrine Pavoine and Jean Thioulouse. Package ade4: Analysis of Ecological Data : Exploratory and Euclidean methods in Environmental sciences. See Also
Examplesdata(laterdata) ## "unique" graph: visAFCM(laterdata) ## "multiple a" graph: visAFCM(laterdata, xax = 1, yax = 2, clab.row = FALSE, clab.col = 1, permute = FALSE, posieig = "top", sub = NULL, graphstyle = "multiple a", graphrow = 2, graphcol = 3, cpoint=3) ## "multiple b" graph: visAFCM(laterdata, xax = 1, yax = 2, clab.row = FALSE, clab.col = 1, permute = FALSE, posieig = "top", sub = NULL, graphstyle = "multiple b", graphrow = 2, graphcol = 3) Results
R version 3.3.1 (2016-06-21) -- "Bug in Your Hair"
Copyright (C) 2016 The R Foundation for Statistical Computing
Platform: x86_64-pc-linux-gnu (64-bit)

R is free software and comes with ABSOLUTELY NO WARRANTY.
You are welcome to redistribute it under certain conditions.
Type 'license()' or 'licence()' for distribution details.

R is a collaborative project with many contributors.
Type 'contributors()' for more information and
'citation()' on how to cite R or R packages in publications.

Type 'demo()' for some demos, 'help()' for on-line help, or
'help.start()' for an HTML browser interface to help.
Type 'q()' to quit R.

> library(Laterality)
> png(filename="/home/ddbj/snapshot/RGM3/R_CC/result/Laterality/visAFCM.Rd_%03d_medium.png", width=480, height=480)
> ### Name: visAFCM
> ### Title: visAFCM: this function plots multiple correspondence analysis
> ###   graphs based on ade4 package functions.
> ### Aliases: visAFCM
> ### Keywords: correspondence AFCM MCA laterality manual preference
>
> ### ** Examples
>
>   data(laterdata)
>   ## "unique" graph:
>   visAFCM(laterdata)
NULL
>
>   ## "multiple a" graph:
>   visAFCM(laterdata, xax = 1, yax = 2, clab.row = FALSE, clab.col = 1,
+   permute = FALSE, posieig = "top", sub = NULL, graphstyle = "multiple a",
+   graphrow = 2, graphcol = 3, cpoint=3)
NULL
>
>   ## "multiple b" graph:
>   visAFCM(laterdata, xax = 1, yax = 2, clab.row = FALSE, clab.col = 1,
+   permute = FALSE, posieig = "top", sub = NULL, graphstyle = "multiple b",
+   graphrow = 2, graphcol = 3)
>
>
>
>
>
> dev.off()
null device
          1
>
|