Supported by Dr. Osamu Ogasawara and  . . |
|
Last data update: 2014.03.03 |
Plots object of class angledistlistDescriptionMakes a plot for every distribution that was fit to the data. Usage## S3 method for class 'angledistlist' plot(x, makepdf=FALSE,...) Arguments
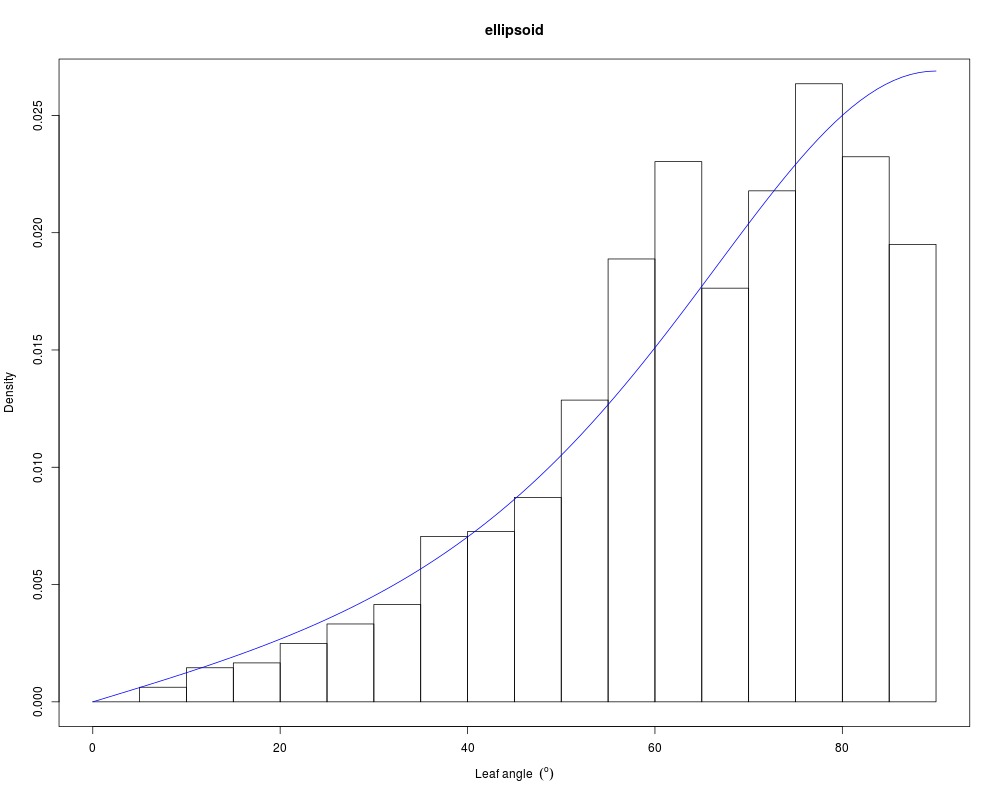
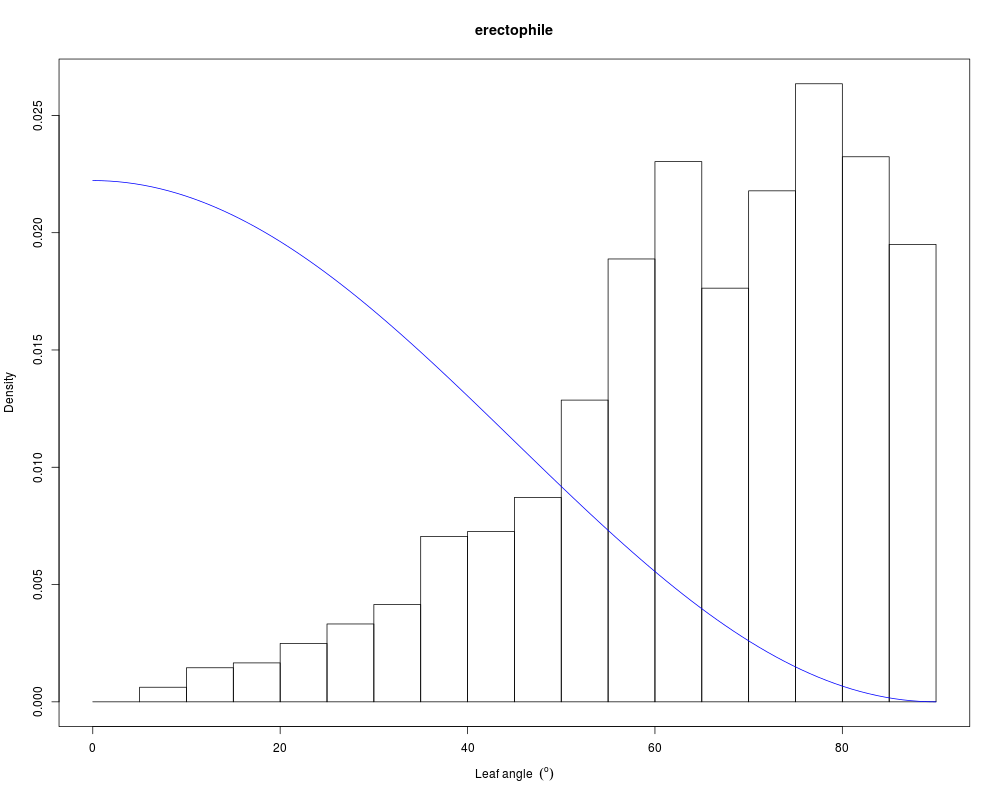
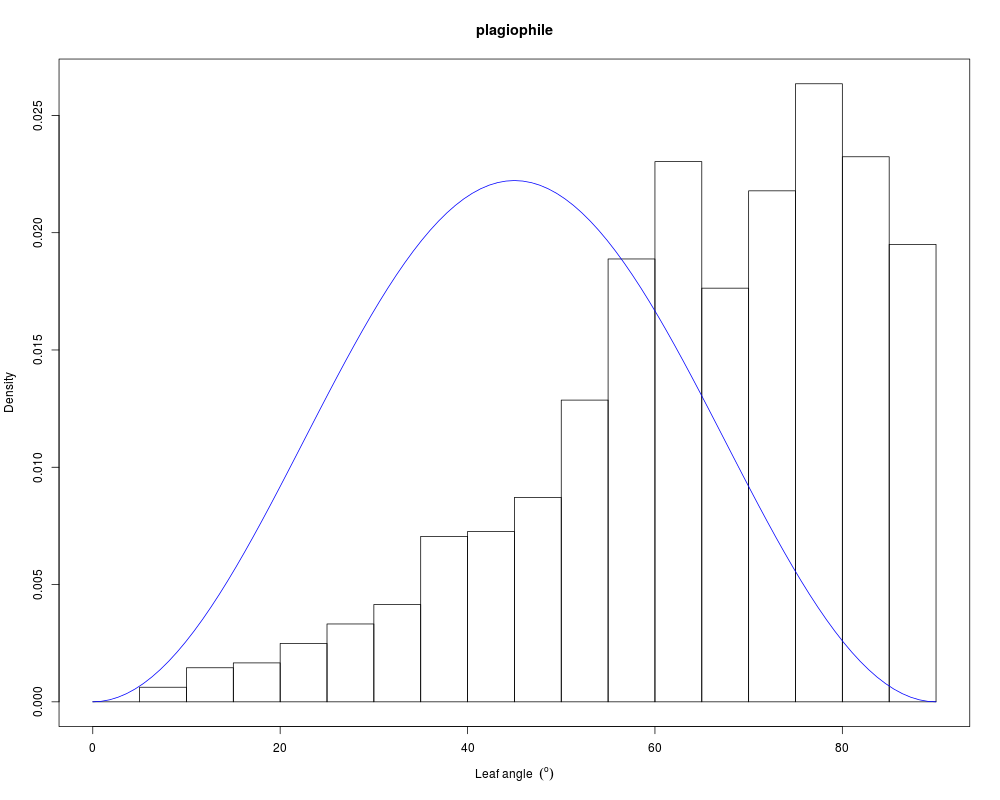
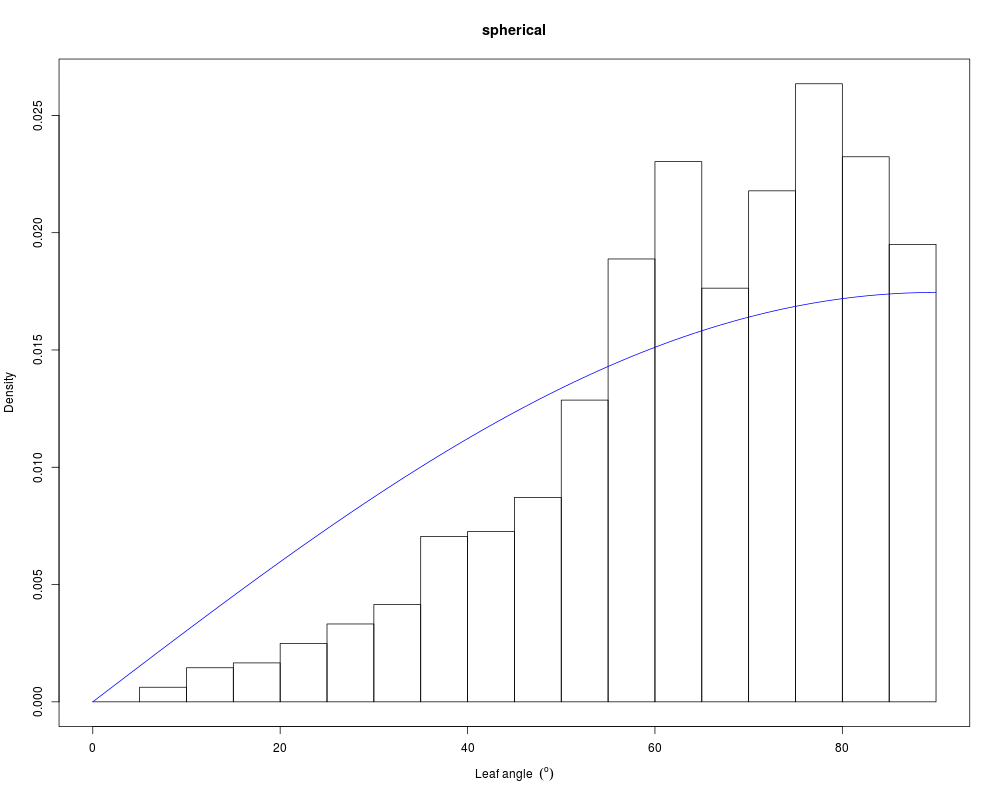
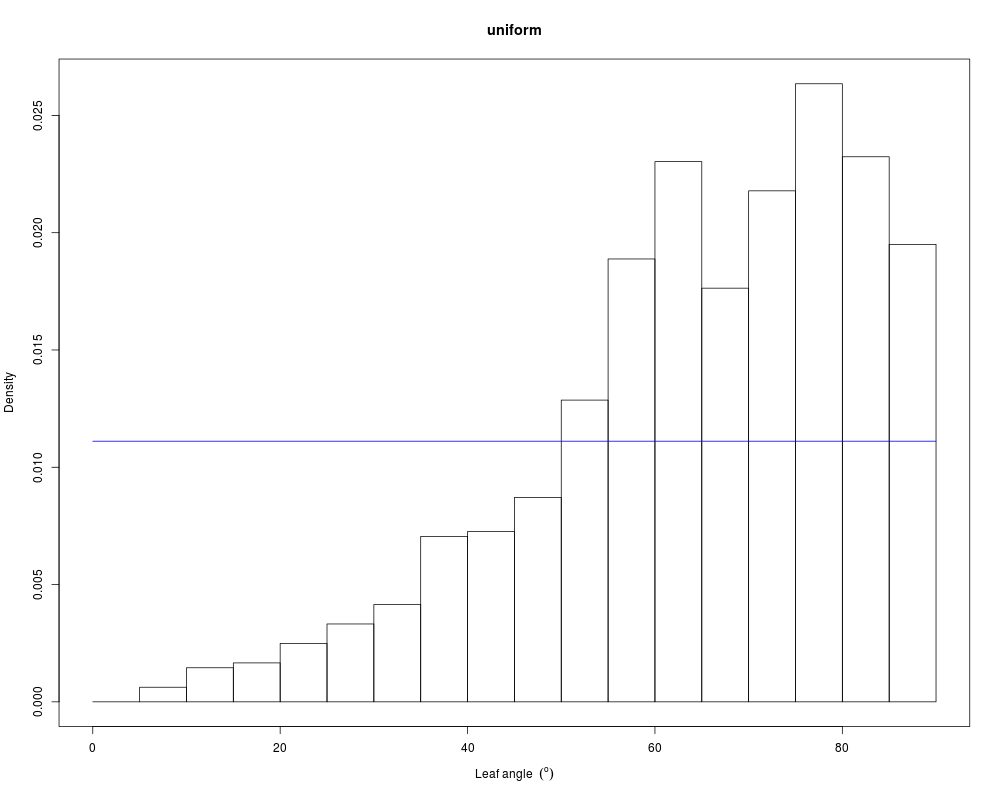
DetailsPlots a histogram of the data used to fit the distribution (if available), and a curve of the density function (in an attractive blue color), one for each distribution. Author(s)Remko Duursma ReferencesWang W.M., Li Z.L. & Su H.B. (2007). Comparison of leaf angle distribution functions: Effects on extinction coefficient and fraction of sunlit foliage. Agricultural and Forest Meteorology, 143, 106-122. See Also
Examples# Fit all distribution; data(eteret) myfits <- fitalldistributions(eteret) # Plot it. plot(myfits) # And look at the results, myfits Results
R version 3.3.1 (2016-06-21) -- "Bug in Your Hair"
Copyright (C) 2016 The R Foundation for Statistical Computing
Platform: x86_64-pc-linux-gnu (64-bit)

R is free software and comes with ABSOLUTELY NO WARRANTY.
You are welcome to redistribute it under certain conditions.
Type 'license()' or 'licence()' for distribution details.

R is a collaborative project with many contributors.
Type 'contributors()' for more information and
'citation()' on how to cite R or R packages in publications.

Type 'demo()' for some demos, 'help()' for on-line help, or
'help.start()' for an HTML browser interface to help.
Type 'q()' to quit R.

> library(LeafAngle)
> png(filename="/home/ddbj/snapshot/RGM3/R_CC/result/LeafAngle/plot.angledistlist.Rd_%03d_medium.png", width=480, height=480)
> ### Name: plot.angledistlist
> ### Title: Plots object of class angledistlist
> ### Aliases: plot.angledistlist
> ### Keywords: misc
>
> ### ** Examples
>
>
> # Fit all distribution;
> data(eteret)
> myfits <- fitalldistributions(eteret)
>
> # Plot it.
> plot(myfits)
>
> # And look at the results,
> myfits
  distribution       AIC  bestfit
1   twoparbeta  7965.684 best fit
2    ellipsoid  7973.202
3   rotatedell  8146.001
4   planophile  7975.312
5  erectophile 12181.856
6  plagiophile 10145.147
7 extremophile 10048.758
8    spherical  8123.015
9      uniform  8675.633
>
>
>
>
>
>
> dev.off()
null device
          1
>
|


Created & Maintained by Osamu Ogasawara (osamu.ogasawara@gmail.com) and 