Supported by Dr. Osamu Ogasawara and  . . |
|
Last data update: 2014.03.03 |
Fill Lexis triangles by HMD dataDescriptionThe function opens an existing Lexis grid and fill the triangles according to data from the Human Mortality Database. Usagelexis.hmd(lg, hmd.data, column) Arguments
DetailsThe function creates a subset of Author(s)Philipp Ottolinger Examples
library(LexisPlotR)
lg <- lexis.grid(year.start = 1980, year.end = 1985, age.start = 0, age.end = 5)
# Load sample data
path <- system.file("extdata", "Deaths_lexis_sample.txt", package = "LexisPlotR")
deaths.triangles <- prepare.hmd(path)
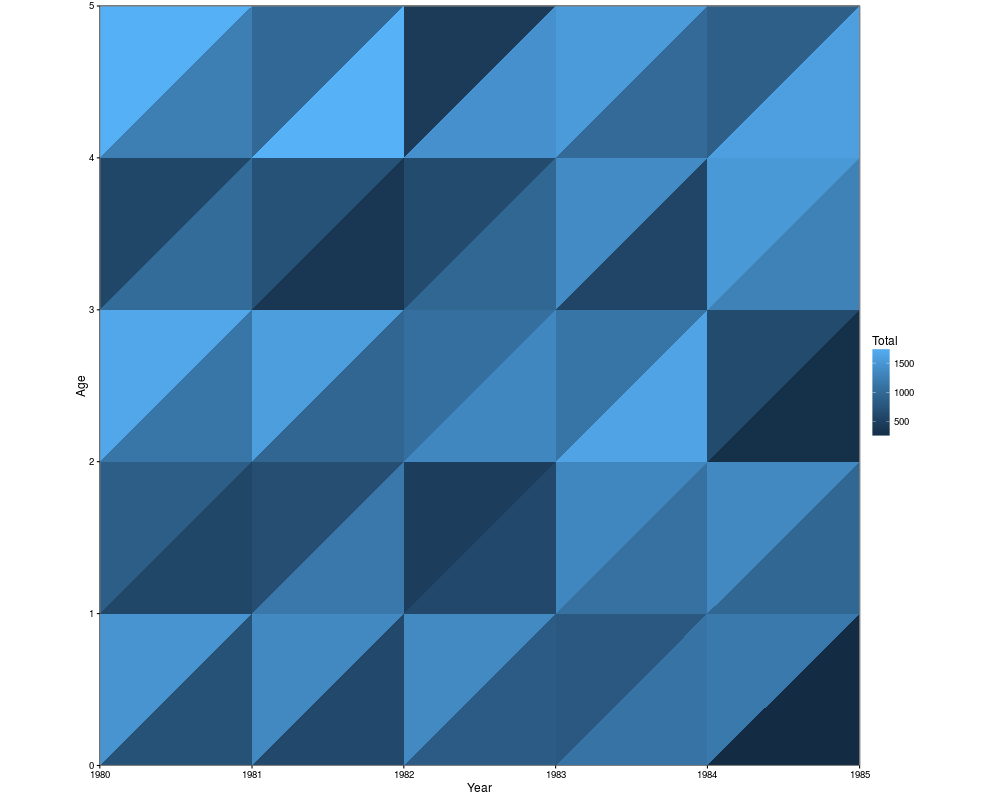
lexis.hmd(lg = lg, hmd.data = deaths.triangles, column = "Total")
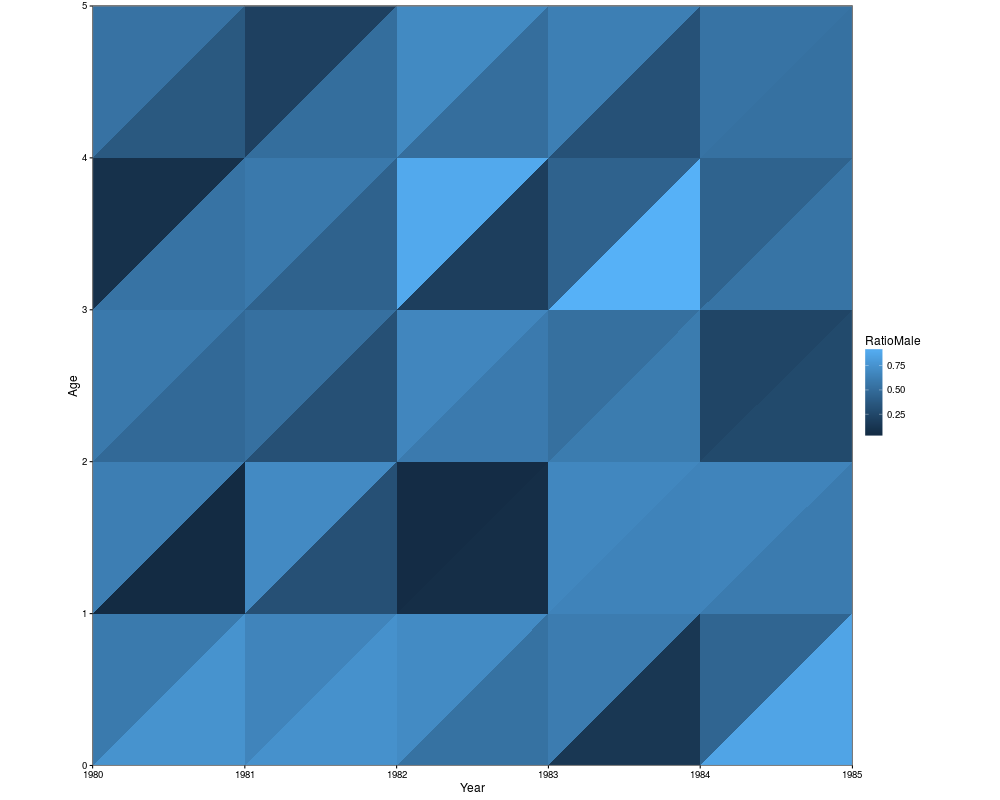
### Plot data not explicitly present in HMD data
deaths.triangles$RatioMale <- deaths.triangles$Male / deaths.triangles$Total
lexis.hmd(lg, deaths.triangles, "RatioMale")
Results
R version 3.3.1 (2016-06-21) -- "Bug in Your Hair"
Copyright (C) 2016 The R Foundation for Statistical Computing
Platform: x86_64-pc-linux-gnu (64-bit)

R is free software and comes with ABSOLUTELY NO WARRANTY.
You are welcome to redistribute it under certain conditions.
Type 'license()' or 'licence()' for distribution details.

R is a collaborative project with many contributors.
Type 'contributors()' for more information and
'citation()' on how to cite R or R packages in publications.

Type 'demo()' for some demos, 'help()' for on-line help, or
'help.start()' for an HTML browser interface to help.
Type 'q()' to quit R.

> library(LexisPlotR)
Loading required package: ggplot2
> png(filename="/home/ddbj/snapshot/RGM3/R_CC/result/LexisPlotR/lexis.hmd.Rd_%03d_medium.png", width=480, height=480)
> ### Name: lexis.hmd
> ### Title: Fill Lexis triangles by HMD data
> ### Aliases: lexis.hmd
>
> ### ** Examples
>
> library(LexisPlotR)
> lg <- lexis.grid(year.start = 1980, year.end = 1985, age.start = 0, age.end = 5)
> # Load sample data
> path <- system.file("extdata", "Deaths_lexis_sample.txt", package = "LexisPlotR")
> deaths.triangles <- prepare.hmd(path)
Warning message:
In prepare.hmd(path) : NAs introduced by coercion
> lexis.hmd(lg = lg, hmd.data = deaths.triangles, column = "Total")
>
> ### Plot data not explicitly present in HMD data
> deaths.triangles$RatioMale <- deaths.triangles$Male / deaths.triangles$Total
> lexis.hmd(lg, deaths.triangles, "RatioMale")
>
>
>
>
>
> dev.off()
null device
          1
>
|
Created & Maintained by Osamu Ogasawara (osamu.ogasawara@gmail.com) and 