Supported by Dr. Osamu Ogasawara and  . . |
|
Last data update: 2014.03.03 |
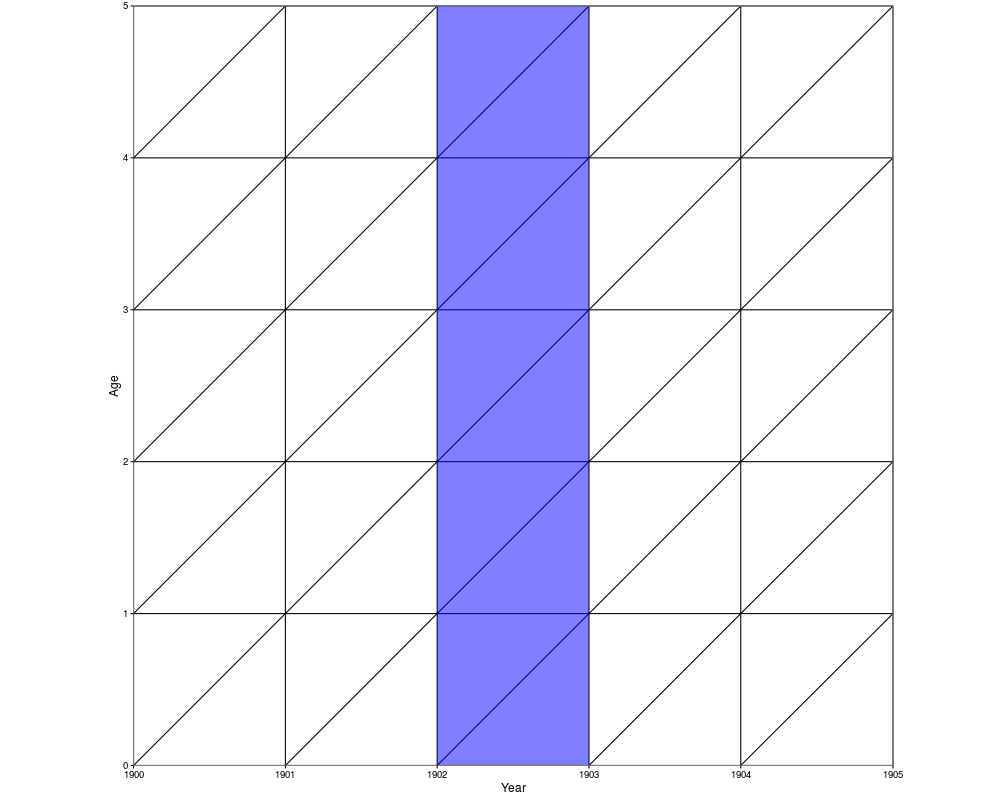
Emphasize a certain year in Lexis grid.DescriptionTakes an existing Lexis grid and adds a coloured rectangle to highlight a certain age. Usagelexis.year(lg, year, fill = "blue", alpha = 0.5) Arguments
DetailsTakes an existing Lexis grid and adds a coloured rectangle to the plot. The rectangle will highlight a certain year in the grid. ValueA ggplot2 object. Author(s)Philipp Ottoliner Exampleslg <- lexis.grid(year.start = 1900, year.end = 1905, age.start = 0, age.end = 5) lexis.year(lg = lg, year = 1902) Results
R version 3.3.1 (2016-06-21) -- "Bug in Your Hair"
Copyright (C) 2016 The R Foundation for Statistical Computing
Platform: x86_64-pc-linux-gnu (64-bit)

R is free software and comes with ABSOLUTELY NO WARRANTY.
You are welcome to redistribute it under certain conditions.
Type 'license()' or 'licence()' for distribution details.

R is a collaborative project with many contributors.
Type 'contributors()' for more information and
'citation()' on how to cite R or R packages in publications.

Type 'demo()' for some demos, 'help()' for on-line help, or
'help.start()' for an HTML browser interface to help.
Type 'q()' to quit R.

> library(LexisPlotR)
Loading required package: ggplot2
> png(filename="/home/ddbj/snapshot/RGM3/R_CC/result/LexisPlotR/lexis.year.Rd_%03d_medium.png", width=480, height=480)
> ### Name: lexis.year
> ### Title: Emphasize a certain year in Lexis grid.
> ### Aliases: lexis.year
>
> ### ** Examples
>
> lg <- lexis.grid(year.start = 1900, year.end = 1905, age.start = 0, age.end = 5)
> lexis.year(lg = lg, year = 1902)
>
>
>
>
>
> dev.off()
null device
          1
>
|
Created & Maintained by Osamu Ogasawara (osamu.ogasawara@gmail.com) and 