Supported by Dr. Osamu Ogasawara and  . . |
|
Last data update: 2014.03.03 |
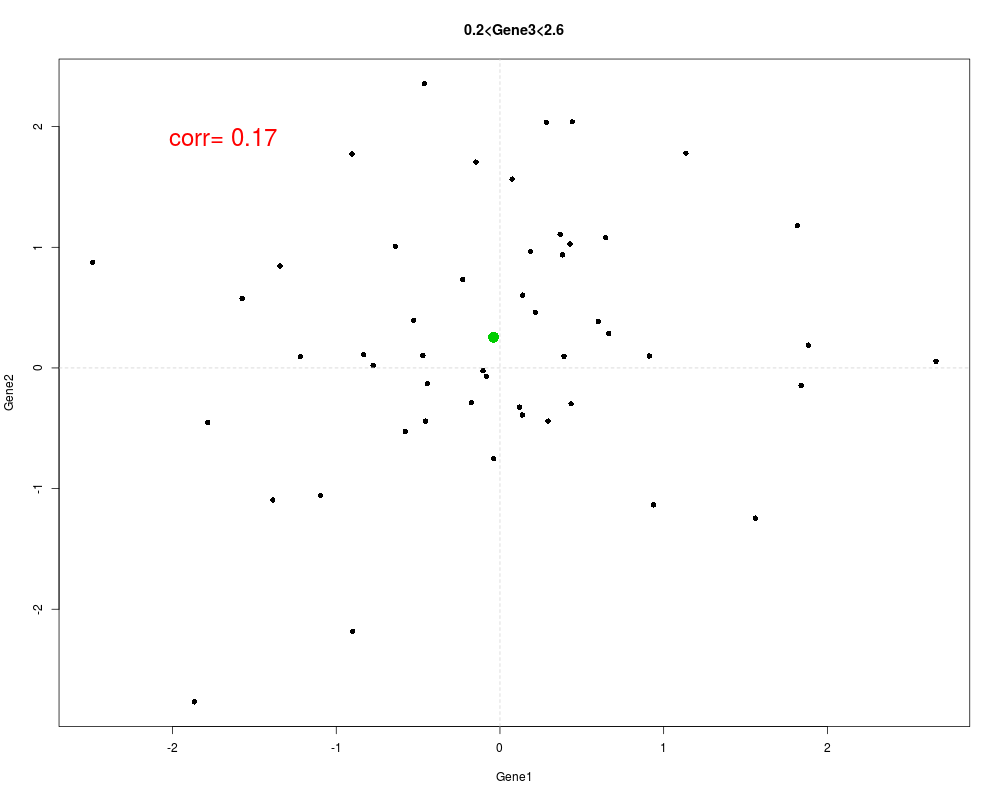
The function plots scatter plots of two variables conditioning on the value of a third variable.Description'plotGLA' is a function to plot the scatter plots of two variables conditioning on the value of a third variable. Arguments
DetailsThe input object can be a numerical matrix with three columns with row representing observations and column representing three variables. It can also be an ExpressionSet object with three features. More detail example about the usage of geneMap is demonstrated in the vignette. Author(s)Yen-Yi Ho ReferencesYen-Yi Ho, Leslie Cope, Thomas A. Louis, and Giovanni Parmigiani, GENERALIZED LIQUID ASSOCIATION (April 2009). Johns Hopkins University, Dept. of Biostatistics Working Papers. Working Paper 183. http://www.bepress.com/jhubiostat/paper183 Examples
data<-matrix(rnorm(300), ncol=3)

colnames(data)<-c("Gene1", "Gene2", "Gene3")

plotGLA(data, cut=3, dim=3, pch=16, filen="GLAplot", save=FALSE)
Results
R version 3.3.1 (2016-06-21) -- "Bug in Your Hair"
Copyright (C) 2016 The R Foundation for Statistical Computing
Platform: x86_64-pc-linux-gnu (64-bit)

R is free software and comes with ABSOLUTELY NO WARRANTY.
You are welcome to redistribute it under certain conditions.
Type 'license()' or 'licence()' for distribution details.

R is a collaborative project with many contributors.
Type 'contributors()' for more information and
'citation()' on how to cite R or R packages in publications.

Type 'demo()' for some demos, 'help()' for on-line help, or
'help.start()' for an HTML browser interface to help.
Type 'q()' to quit R.

> library(LiquidAssociation)
Loading required package: geepack
Loading required package: yeastCC
Loading required package: Biobase
Loading required package: BiocGenerics
Loading required package: parallel

Attaching package: 'BiocGenerics'

The following objects are masked from 'package:parallel':

    clusterApply, clusterApplyLB, clusterCall, clusterEvalQ,
    clusterExport, clusterMap, parApply, parCapply, parLapply,
    parLapplyLB, parRapply, parSapply, parSapplyLB

The following objects are masked from 'package:stats':

    IQR, mad, xtabs

The following objects are masked from 'package:base':

    Filter, Find, Map, Position, Reduce, anyDuplicated, append,
    as.data.frame, cbind, colnames, do.call, duplicated, eval, evalq,
    get, grep, grepl, intersect, is.unsorted, lapply, lengths, mapply,
    match, mget, order, paste, pmax, pmax.int, pmin, pmin.int, rank,
    rbind, rownames, sapply, setdiff, sort, table, tapply, union,
    unique, unsplit

Welcome to Bioconductor

    Vignettes contain introductory material; view with
    'browseVignettes()'. To cite Bioconductor, see
    'citation("Biobase")', and for packages 'citation("pkgname")'.

Loading required package: org.Sc.sgd.db
Loading required package: AnnotationDbi
Loading required package: stats4
Loading required package: IRanges
Loading required package: S4Vectors

Attaching package: 'S4Vectors'

The following objects are masked from 'package:base':

    colMeans, colSums, expand.grid, rowMeans, rowSums


> png(filename="/home/ddbj/snapshot/RGM3/R_BC/result/LiquidAssociation/plotGLA-methods.Rd_%03d_medium.png", width=480, height=480)
> ### Name: plotGLA-methods
> ### Title: The function plots scatter plots of two variables conditioning
> ###   on the value of a third variable.
> ### Aliases: plotGLA-methods plotGLA,eSet-method plotGLA,matrix-method
> ###   plotGLA
> ### Keywords: methods
>
> ### ** Examples
>
> data<-matrix(rnorm(300), ncol=3)
>
> colnames(data)<-c("Gene1", "Gene2", "Gene3")
>
> plotGLA(data, cut=3, dim=3, pch=16, filen="GLAplot", save=FALSE)
>
>
>
>
>
>
> dev.off()
null device
          1
>
|