Supported by Dr. Osamu Ogasawara and  . . |
|
Last data update: 2014.03.03 |
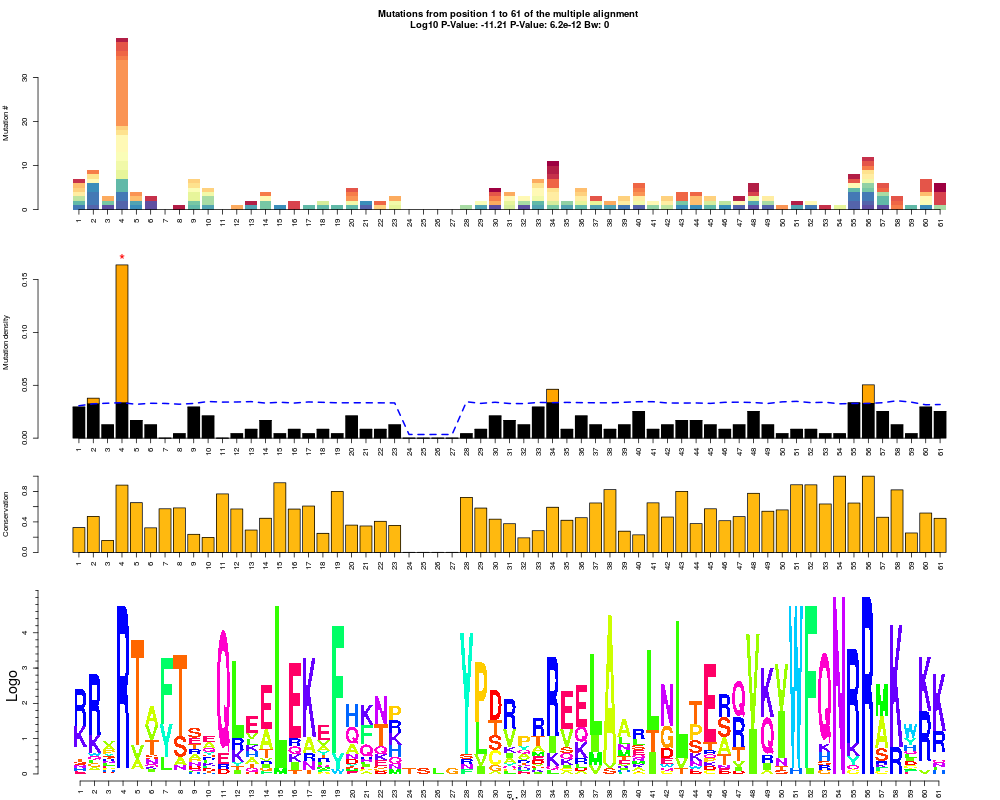
Draw a comprehensive LowMACA plotDescriptionLowMACA comprehensive plot is a four layers plot that summarize the entire LowMACA output UsagelmPlot(object , conservation=NULL, splitLen=NULL) Arguments
DetailsThe method returns a plot, which is divided into four layers.
The LowMACA object must have been passed through the methods
If this plot is used on a LowMACA object with a single protein, the result is formed by three layers only:
ValueNULL Author(s)Stefano de Pretis , Giorgio Melloni See Also
Examples#Load homeobox example and draw the plot data(lmObj) #Calculate statistics for nullProfile lmObj <- entropy(lmObj) lmPlot(lmObj) Results
R version 3.3.1 (2016-06-21) -- "Bug in Your Hair"
Copyright (C) 2016 The R Foundation for Statistical Computing
Platform: x86_64-pc-linux-gnu (64-bit)

R is free software and comes with ABSOLUTELY NO WARRANTY.
You are welcome to redistribute it under certain conditions.
Type 'license()' or 'licence()' for distribution details.

R is a collaborative project with many contributors.
Type 'contributors()' for more information and
'citation()' on how to cite R or R packages in publications.

Type 'demo()' for some demos, 'help()' for on-line help, or
'help.start()' for an HTML browser interface to help.
Type 'q()' to quit R.

> library(LowMACA)
Checking if clustalo is in the PATH...
Checking perl installation...
Checking perl modules XML::Simple and LWP...
Can't locate XML/Simple.pm in @INC (you may need to install the XML::Simple module) (@INC contains: /etc/perl /usr/local/lib/x86_64-linux-gnu/perl/5.22.1 /usr/local/share/perl/5.22.1 /usr/lib/x86_64-linux-gnu/perl5/5.22 /usr/share/perl5 /usr/lib/x86_64-linux-gnu/perl/5.22 /usr/share/perl/5.22 /usr/local/lib/site_perl /usr/lib/x86_64-linux-gnu/perl-base .).
BEGIN failed--compilation aborted.
Warning messages:
1: In .ClustalChecks(ClustalCommand = "clustalo") :
  Clustal Omega is not in the PATH:
You can either change clustalo command using lmParams function or use the web service. See ?setup
2: running command '/usr/bin/perl -MXML::Simple -e 1' had status 2
3: In .PerlModuleChecks(stop = FALSE, perl = "perl") :
  XML::Simple module for perl is not installed.
            If you don't want to install a local clustal omega and use the web service, XML::Simple is required

> png(filename="/home/ddbj/snapshot/RGM3/R_BC/result/LowMACA/lmPlot.Rd_%03d_medium.png", width=480, height=480)
> ### Name: lmPlot
> ### Title: Draw a comprehensive LowMACA plot
> ### Aliases: lmPlot
>
> ### ** Examples
>
> #Load homeobox example and draw the plot
> data(lmObj)
> #Calculate statistics for nullProfile
> lmObj <- entropy(lmObj)
Making uniform model...
Assigned bandwidth: 0
> lmPlot(lmObj)
>
>
>
>
>
> dev.off()
null device
          1
>
|