Supported by Dr. Osamu Ogasawara and  . . |
|
Last data update: 2014.03.03 |
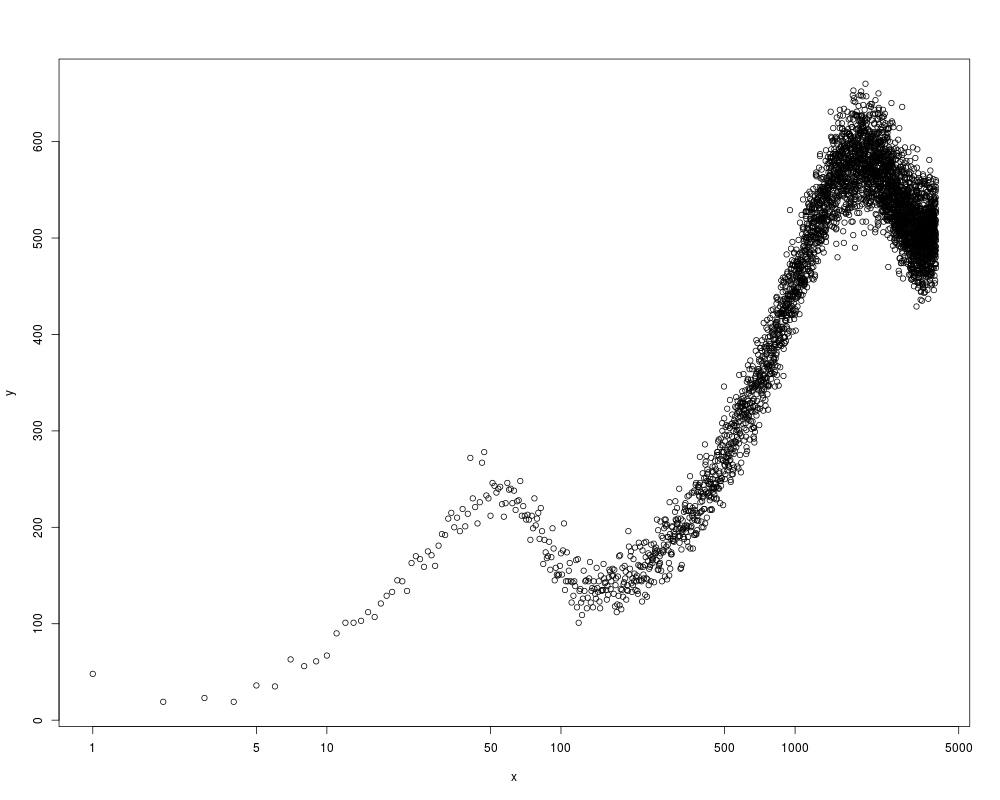
Example data for fit_LMCurve() in the package LuminescenceDescriptionLineraly modulated (LM) measurement data from a quartz sample from Norway including background measurement. Measurements carried out in the luminescence laboratory at the University of Bayreuth. FormatTwo objects (data.frames) with two columns (time and counts). Source
ReferencesFuchs, M., Kreutzer, S., Fischer, M., Sauer, D., Soerensen, R., 2012. OSL and IRSL dating of raised beach sand deposits along the southeastern coast of Norway. Quaternary Geochronology, 10, 195-200. Examples##show LM data data(ExampleData.FittingLM, envir = environment()) plot(values.curve,log="x") Results
R version 3.3.1 (2016-06-21) -- "Bug in Your Hair"
Copyright (C) 2016 The R Foundation for Statistical Computing
Platform: x86_64-pc-linux-gnu (64-bit)

R is free software and comes with ABSOLUTELY NO WARRANTY.
You are welcome to redistribute it under certain conditions.
Type 'license()' or 'licence()' for distribution details.

R is a collaborative project with many contributors.
Type 'contributors()' for more information and
'citation()' on how to cite R or R packages in publications.

Type 'demo()' for some demos, 'help()' for on-line help, or
'help.start()' for an HTML browser interface to help.
Type 'q()' to quit R.

> library(Luminescence)
Welcome to the R package Luminescence version 0.6.0 [Built: 2016-05-30 16:47:30 UTC]
A data import function: 'Better late than never.'
> png(filename="/home/ddbj/snapshot/RGM3/R_CC/result/Luminescence/ExampleData.FittingLM.Rd_%03d_medium.png", width=480, height=480)
> ### Name: ExampleData.FittingLM
> ### Title: Example data for fit_LMCurve() in the package Luminescence
> ### Aliases: ExampleData.FittingLM
>
> ### ** Examples
>
>
> ##show LM data
> data(ExampleData.FittingLM, envir = environment())
> plot(values.curve,log="x")
>
>
>
>
>
>
> dev.off()
null device
          1
>
|
Created & Maintained by Osamu Ogasawara (osamu.ogasawara@gmail.com) and 