Supported by Dr. Osamu Ogasawara and  . . |
|
Last data update: 2014.03.03 |
Analyse SAR TL measurementsDescriptionThe function performs a SAR TL analysis on a
Usage
analyse_SAR.TL(object, object.background, signal.integral.min,
  signal.integral.max, sequence.structure = c("PREHEAT", "SIGNAL",
  "BACKGROUND"), rejection.criteria = list(recycling.ratio = 10,
  recuperation.rate = 10), dose.points, log = "", ...)
Arguments
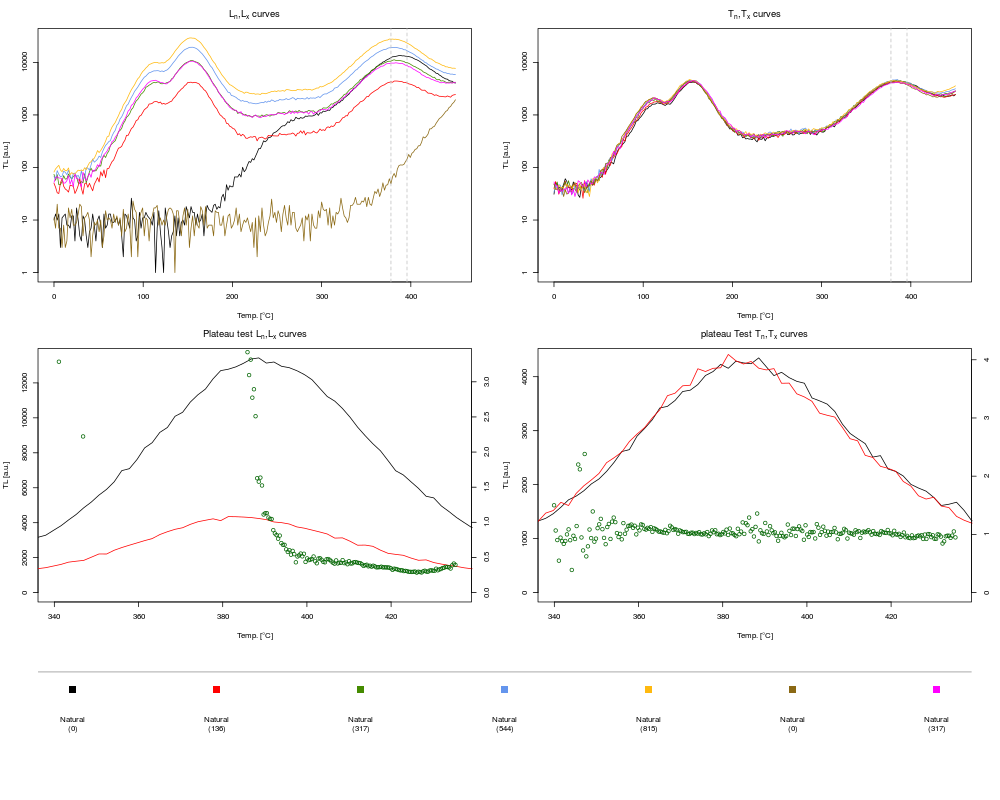
DetailsThis function performs a SAR TL analysis on a set of curves. The SAR
procedure in general is given by Murray and Wintle (2000). For the
calculation of the Lx/Tx value the function calc_TLLxTxRatio is
used. ValueA plot (optional) and an
Function version0.1.4 (2015-11-29 17:27:48) NoteTHIS IS A BETA VERSION Author(s)Sebastian Kreutzer, IRAMAT-CRP2A, Universite Bordeaux Montaigne (France)
ReferencesAitken, M.J. and Smith, B.W., 1988. Optical dating: recuperation after bleaching. Quaternary Science Reviews 7, 387-393. Murray, A.S. and Wintle, A.G., 2000. Luminescence dating of quartz using an improved single-aliquot regenerative-dose protocol. Radiation Measurements 32, 57-73. See Also
Examples
##load data
data(ExampleData.BINfileData, envir = environment())

##transform the values from the first position in a RLum.Analysis object
object <- Risoe.BINfileData2RLum.Analysis(TL.SAR.Data, pos=3)

##perform analysis
analyse_SAR.TL(object,
               signal.integral.min = 210,
               signal.integral.max = 220,
               log = "y",
               fit.method = "EXP OR LIN",
               sequence.structure = c("SIGNAL", "BACKGROUND"))
Results
R version 3.3.1 (2016-06-21) -- "Bug in Your Hair"
Copyright (C) 2016 The R Foundation for Statistical Computing
Platform: x86_64-pc-linux-gnu (64-bit)
R is free software and comes with ABSOLUTELY NO WARRANTY.
You are welcome to redistribute it under certain conditions.
Type 'license()' or 'licence()' for distribution details.
R is a collaborative project with many contributors.
Type 'contributors()' for more information and
'citation()' on how to cite R or R packages in publications.
Type 'demo()' for some demos, 'help()' for on-line help, or
'help.start()' for an HTML browser interface to help.
Type 'q()' to quit R.
> library(Luminescence)
Welcome to the R package Luminescence version 0.6.0 [Built: 2016-05-30 16:47:30 UTC]
Anonymous student hotel employee: 'Let me double check this.'
> png(filename="/home/ddbj/snapshot/RGM3/R_CC/result/Luminescence/analyse_SAR.TL.Rd_%03d_medium.png", width=480, height=480)
> ### Name: analyse_SAR.TL
> ### Title: Analyse SAR TL measurements
> ### Aliases: analyse_SAR.TL
> ### Keywords: datagen plot
>
> ### ** Examples
>
>
>
> ##load data
> data(ExampleData.BINfileData, envir = environment())
>
> ##transform the values from the first position in a RLum.Analysis object
> object <- Risoe.BINfileData2RLum.Analysis(TL.SAR.Data, pos=3)
>
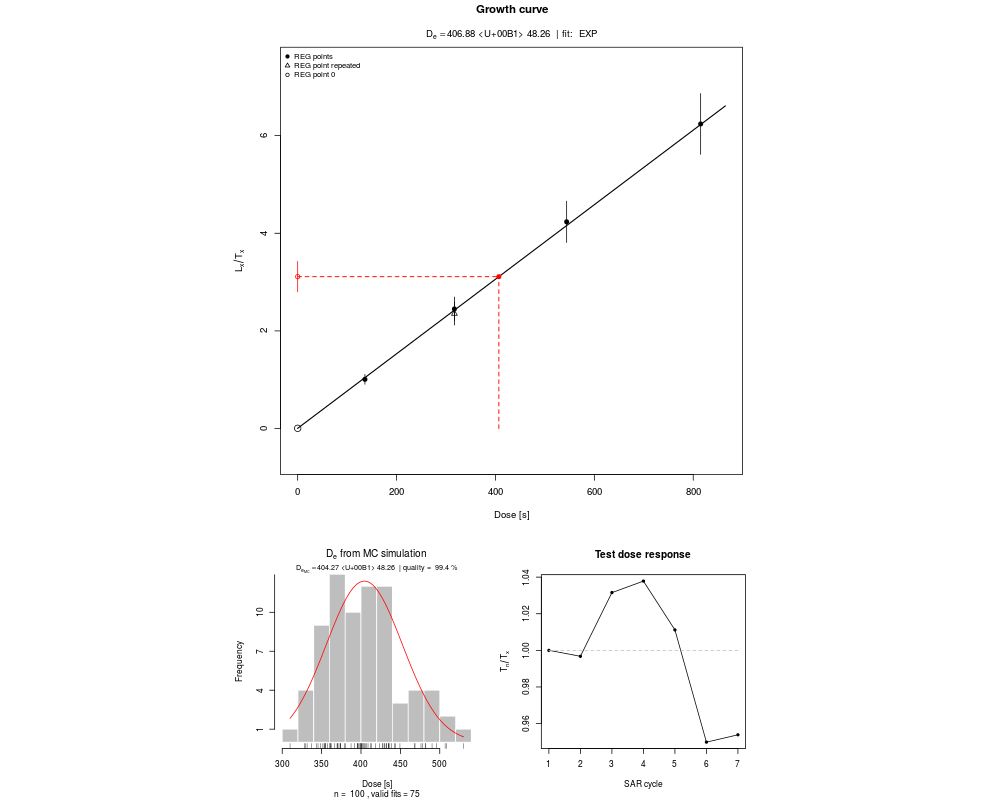
> ##perform analysis
> analyse_SAR.TL(object,
+ signal.integral.min = 210,
+ signal.integral.max = 220,
+ log = "y",
+ fit.method = "EXP OR LIN",
+ sequence.structure = c("SIGNAL", "BACKGROUND"))
[plot_GrowthCurve()] Fit: EXP OR LIN | De = 406.86 | D01 = 615183610.2
[RLum.Results]
originator: analyse_SAR.TL()
data: 3
.. $De.values : data.frame
.. $LnLxTnTx.table : data.frame
.. $rejection.criteria : data.frame
additional info elements: 0There were 50 or more warnings (use warnings() to see the first 50)
>
>
>
>
>
>
> dev.off()
null device
1
>
|