Supported by Dr. Osamu Ogasawara and  . . |
|
Last data update: 2014.03.03 |
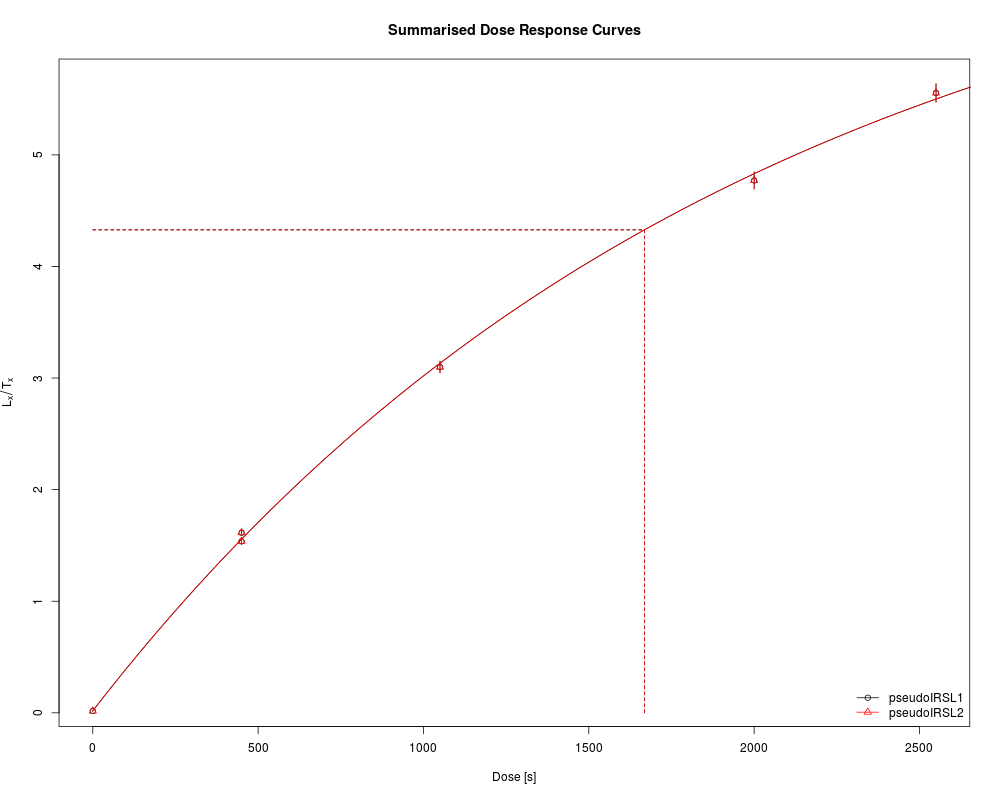
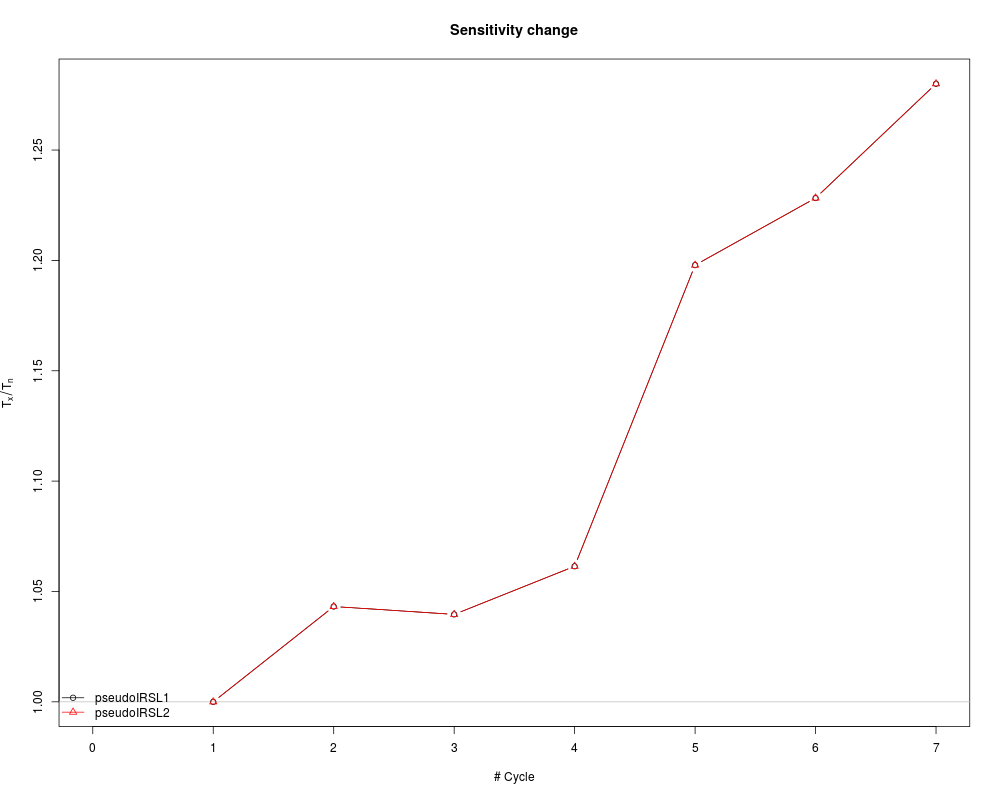
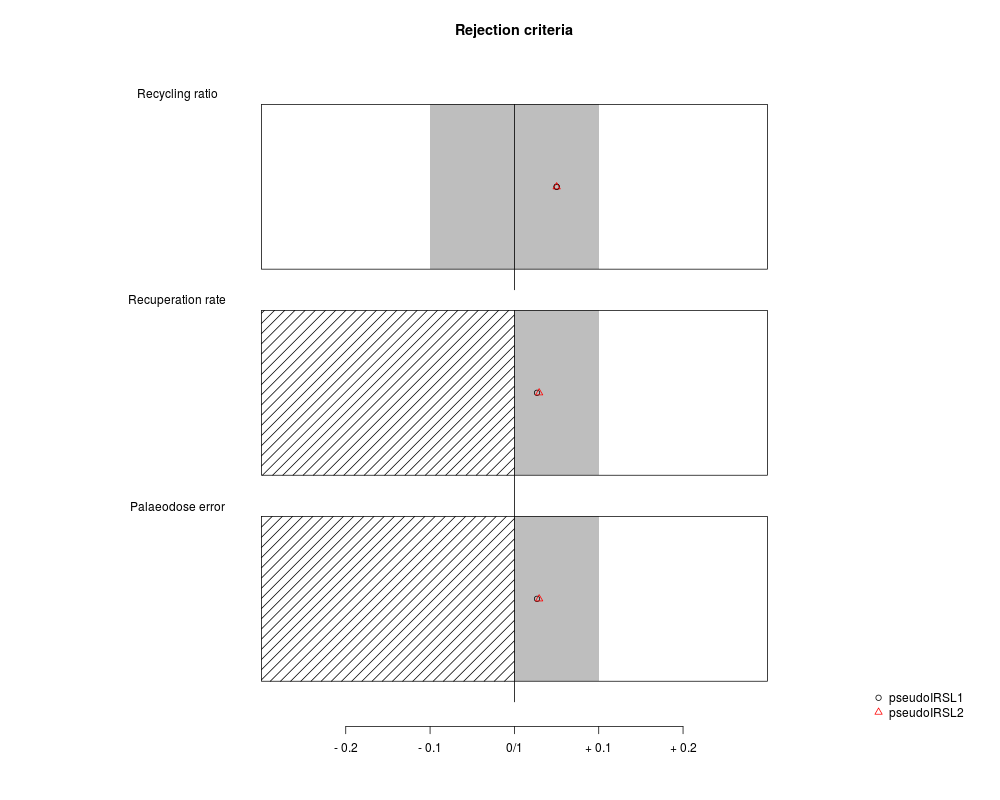
Analyse post-IR IRSL sequencesDescriptionThe function performs an analysis of post-IR IRSL sequences including curve
fitting on Usage
analyse_pIRIRSequence(object, signal.integral.min, signal.integral.max,
  background.integral.min, background.integral.max, dose.points = NULL,
  sequence.structure = c("TL", "IR50", "pIRIR225"), plot = TRUE,
  plot.single = FALSE, ...)
Arguments
DetailsTo allow post-IR IRSL protocol (Thomsen et al., 2008) measurement analyses
this function has been written as extended wrapper function for the function
If the input is a If the input is a list of RLum.Analysis-objects, every argument can be provided as list to allow
for different sets of parameters for every single input element.
For further information see ValuePlots (optional) and an
The output should be accessed using the function
Function version0.2.0 (2016-01-18 15:07:46) NoteBest graphical output can be achieved by using the function Author(s)Sebastian Kreutzer, IRAMAT-CRP2A, Universite Bordeaux Montaigne
(France)
ReferencesMurray, A.S., Wintle, A.G., 2000. Luminescence dating of quartz using an improved single-aliquot regenerative-dose protocol. Radiation Measurements 32, 57-73. doi:10.1016/S1350-4487(99)00253-X Thomsen, K.J., Murray, A.S., Jain, M., Boetter-Jensen, L., 2008. Laboratory fading rates of various luminescence signals from feldspar-rich sediment extracts. Radiation Measurements 43, 1474-1486. doi:10.1016/j.radmeas.2008.06.002 See Also
Examples
### NOTE: For this example existing example data are used. These data are non pIRIR data.
###
##(1) Compile example data set based on existing example data (SAR quartz measurement)
##(a) Load example data
data(ExampleData.BINfileData, envir = environment())
##(b) Transform the values from the first position in a RLum.Analysis object
object <- Risoe.BINfileData2RLum.Analysis(CWOSL.SAR.Data, pos=1)
##(c) Grep curves and exclude the last two (one TL and one IRSL)
object <- get_RLum(object, record.id = c(-29,-30))
##(d) Define new sequence structure and set new RLum.Analysis object
sequence.structure <- c(1,2,2,3,4,4)
sequence.structure <- as.vector(sapply(seq(0,length(object)-1,by = 4),
function(x){sequence.structure + x}))
object <- sapply(1:length(sequence.structure), function(x){
object[[sequence.structure[x]]]
})
object <- set_RLum(class = "RLum.Analysis", records = object, protocol = "pIRIR")
##(2) Perform pIRIR analysis (for this example with quartz OSL data!)
## Note: output as single plots to avoid problems with this example
results <- analyse_pIRIRSequence(object,
signal.integral.min = 1,
signal.integral.max = 2,
background.integral.min = 900,
background.integral.max = 1000,
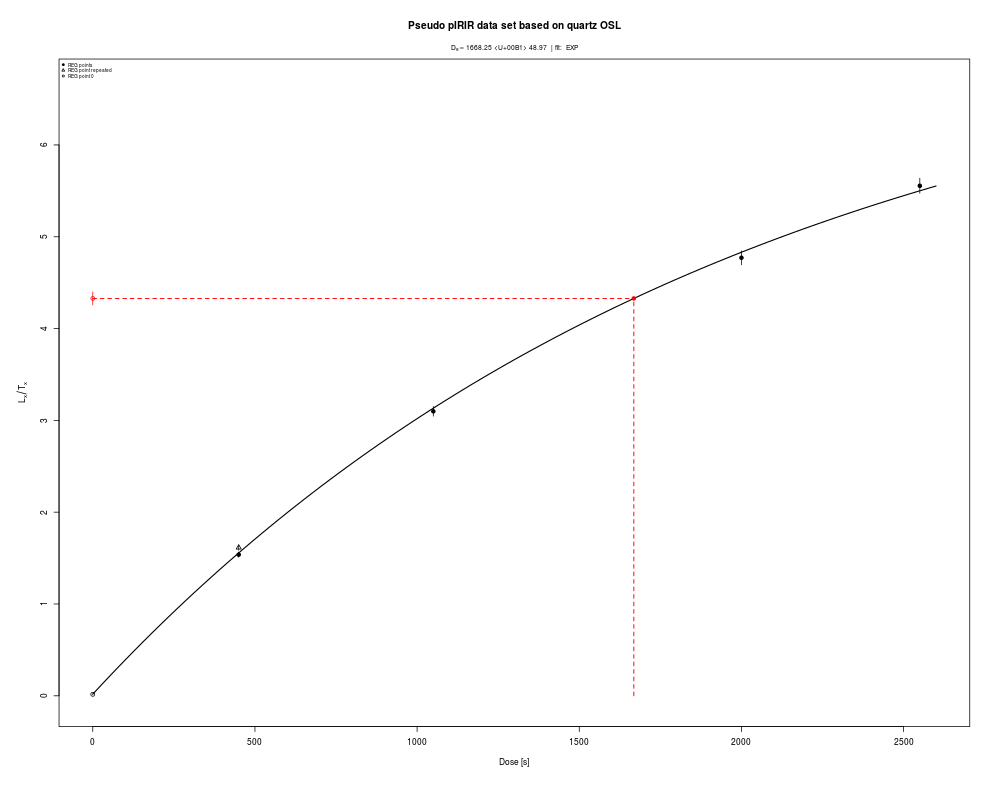
fit.method = "EXP",
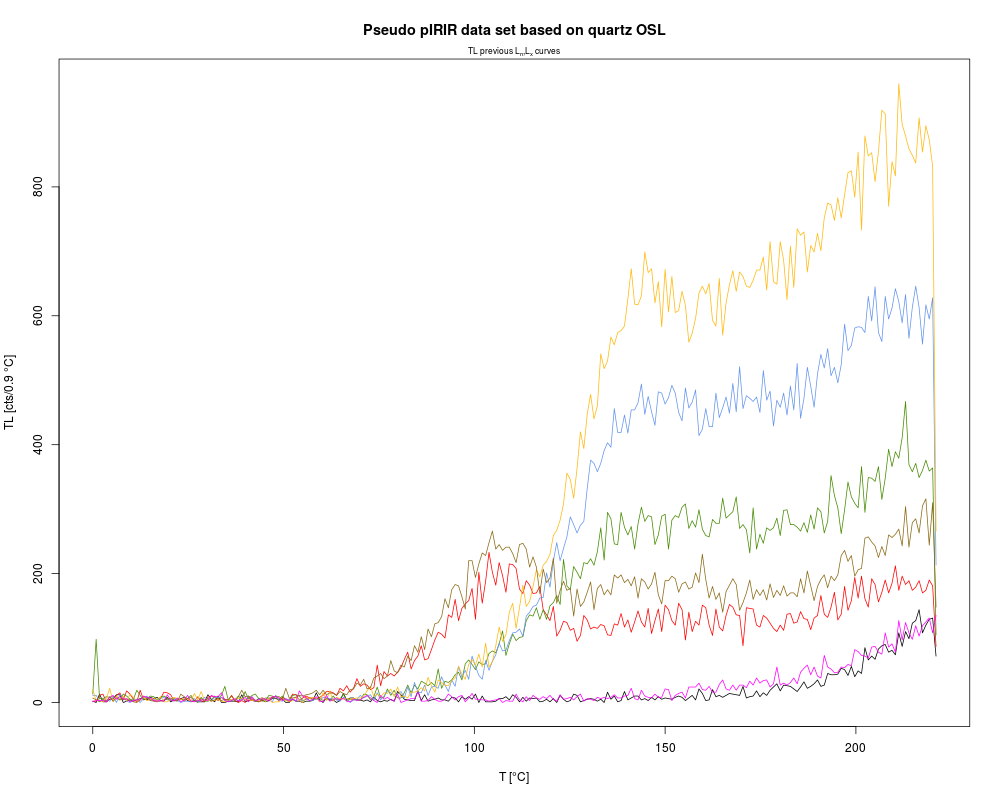
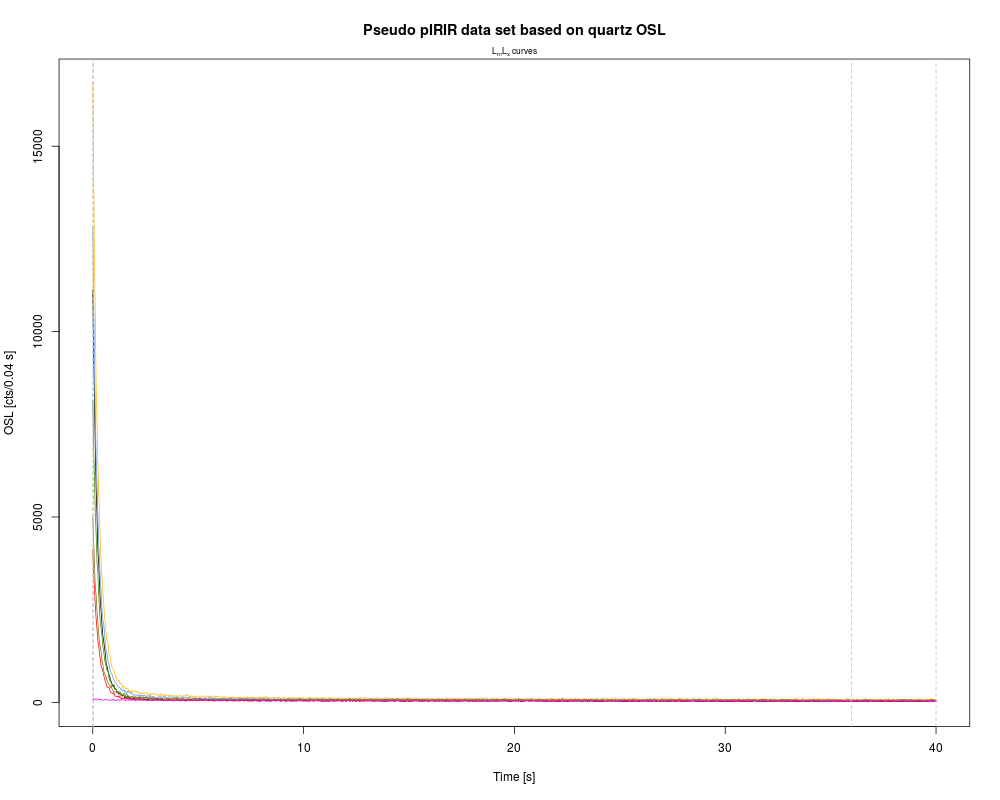
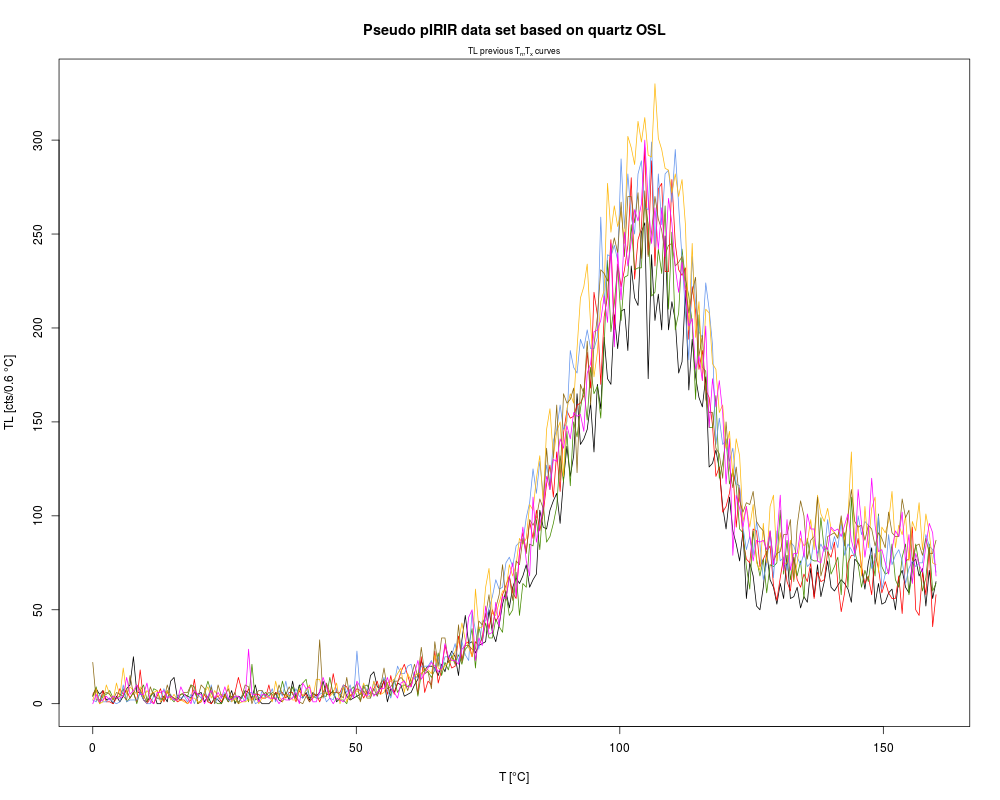
sequence.structure = c("TL", "pseudoIRSL1", "pseudoIRSL2"),
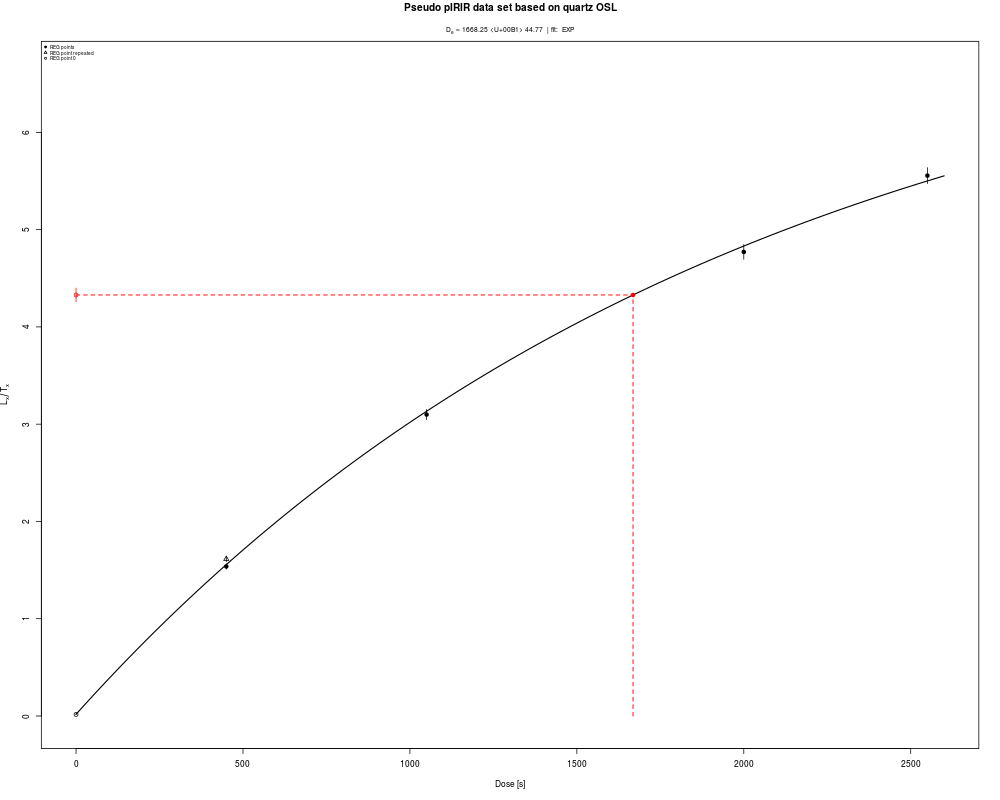
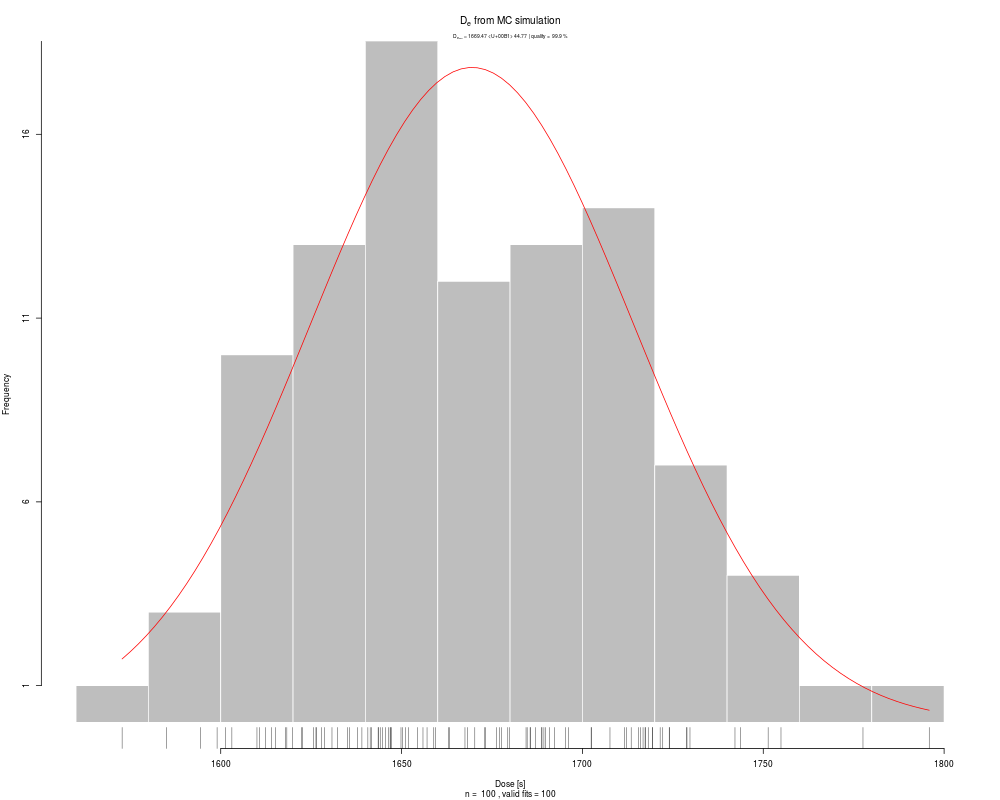
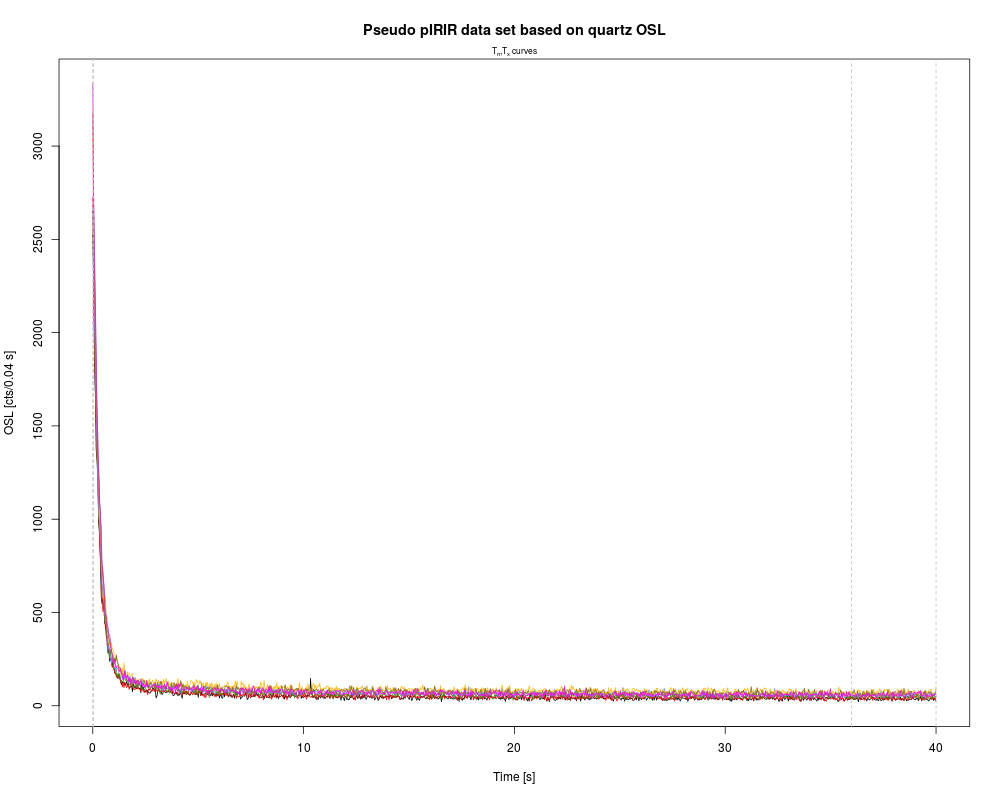
main = "Pseudo pIRIR data set based on quartz OSL",
plot.single = TRUE)
##(3) Perform pIRIR analysis (for this example with quartz OSL data!)
## Alternative for PDF output, uncomment and complete for usage
## Not run:
pdf(file = "...", height = 15, width =
15)
results <- analyse_pIRIRSequence(object,
signal.integral.min = 1,
signal.integral.max = 2,
background.integral.min = 900,
background.integral.max = 1000,
fit.method = "EXP",
main = "Pseudo pIRIR data set based on quartz OSL")
dev.off()
## End(Not run)
Results
R version 3.3.1 (2016-06-21) -- "Bug in Your Hair"
Copyright (C) 2016 The R Foundation for Statistical Computing
Platform: x86_64-pc-linux-gnu (64-bit)
R is free software and comes with ABSOLUTELY NO WARRANTY.
You are welcome to redistribute it under certain conditions.
Type 'license()' or 'licence()' for distribution details.
R is a collaborative project with many contributors.
Type 'contributors()' for more information and
'citation()' on how to cite R or R packages in publications.
Type 'demo()' for some demos, 'help()' for on-line help, or
'help.start()' for an HTML browser interface to help.
Type 'q()' to quit R.
> library(Luminescence)
Welcome to the R package Luminescence version 0.6.0 [Built: 2016-05-30 16:47:30 UTC]
An enthusiastic cabaret artist: 'Political elections are like brushing teeth: if you don't do it, things become brown.'
> png(filename="/home/ddbj/snapshot/RGM3/R_CC/result/Luminescence/analyse_pIRIRSequence.Rd_%03d_medium.png", width=480, height=480)
> ### Name: analyse_pIRIRSequence
> ### Title: Analyse post-IR IRSL sequences
> ### Aliases: analyse_pIRIRSequence
> ### Keywords: datagen plot
>
> ### ** Examples
>
>
>
> ### NOTE: For this example existing example data are used. These data are non pIRIR data.
> ###
> ##(1) Compile example data set based on existing example data (SAR quartz measurement)
> ##(a) Load example data
> data(ExampleData.BINfileData, envir = environment())
>
> ##(b) Transform the values from the first position in a RLum.Analysis object
> object <- Risoe.BINfileData2RLum.Analysis(CWOSL.SAR.Data, pos=1)
>
> ##(c) Grep curves and exclude the last two (one TL and one IRSL)
> object <- get_RLum(object, record.id = c(-29,-30))
>
> ##(d) Define new sequence structure and set new RLum.Analysis object
> sequence.structure <- c(1,2,2,3,4,4)
> sequence.structure <- as.vector(sapply(seq(0,length(object)-1,by = 4),
+ function(x){sequence.structure + x}))
>
> object <- sapply(1:length(sequence.structure), function(x){
+
+ object[[sequence.structure[x]]]
+
+ })
>
> object <- set_RLum(class = "RLum.Analysis", records = object, protocol = "pIRIR")
>
> ##(2) Perform pIRIR analysis (for this example with quartz OSL data!)
> ## Note: output as single plots to avoid problems with this example
> results <- analyse_pIRIRSequence(object,
+ signal.integral.min = 1,
+ signal.integral.max = 2,
+ background.integral.min = 900,
+ background.integral.max = 1000,
+ fit.method = "EXP",
+ sequence.structure = c("TL", "pseudoIRSL1", "pseudoIRSL2"),
+ main = "Pseudo pIRIR data set based on quartz OSL",
+ plot.single = TRUE)
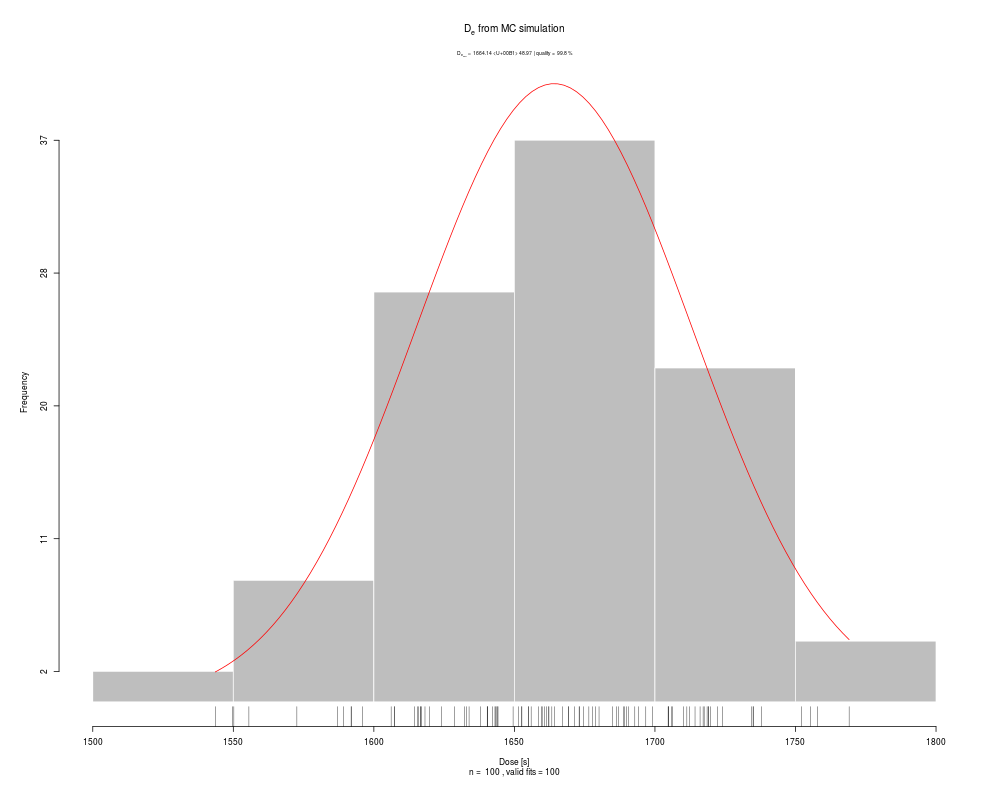
[plot_GrowthCurve()] Fit: EXP | De = 1668.25 | D01 = 1982.76
[plot_GrowthCurve()] Fit: EXP | De = 1668.25 | D01 = 1982.76
>
>
> ##(3) Perform pIRIR analysis (for this example with quartz OSL data!)
> ## Alternative for PDF output, uncomment and complete for usage
> ## Not run:
> ##D pdf(file = "...", height = 15, width = 15)
> ##D results <- analyse_pIRIRSequence(object,
> ##D signal.integral.min = 1,
> ##D signal.integral.max = 2,
> ##D background.integral.min = 900,
> ##D background.integral.max = 1000,
> ##D fit.method = "EXP",
> ##D main = "Pseudo pIRIR data set based on quartz OSL")
> ##D
> ##D dev.off()
> ## End(Not run)
>
>
>
>
>
>
> dev.off()
null device
1
>
|