Supported by Dr. Osamu Ogasawara and  . . |
|
Last data update: 2014.03.03 |
Collection of layout definitionsDescriptionThis helper function returns a list with layout definitions for homogeneous plotting. Usageget_Layout(layout) Arguments
DetailsThe easiest way to create a user-specific layout definition is perhaps to
create either an empty or a default layout object and fill/modify the
definitions ( ValueA list object with layout definitions for plot functions. Function version0.1 (2016-05-17 22:39:50) Author(s)Michael Dietze, GFZ Potsdam (Germany)
Examples
## read example data set
data(ExampleData.DeValues, envir = environment())
## show structure of the default layout definition
layout.default <- get_Layout(layout = "default")
str(layout.default)
## show colour definitions for Abanico plot, only
layout.default$abanico$colour
## set Abanico plot title colour to orange
layout.default$abanico$colour$main <- "orange"
## create Abanico plot with modofied layout definition
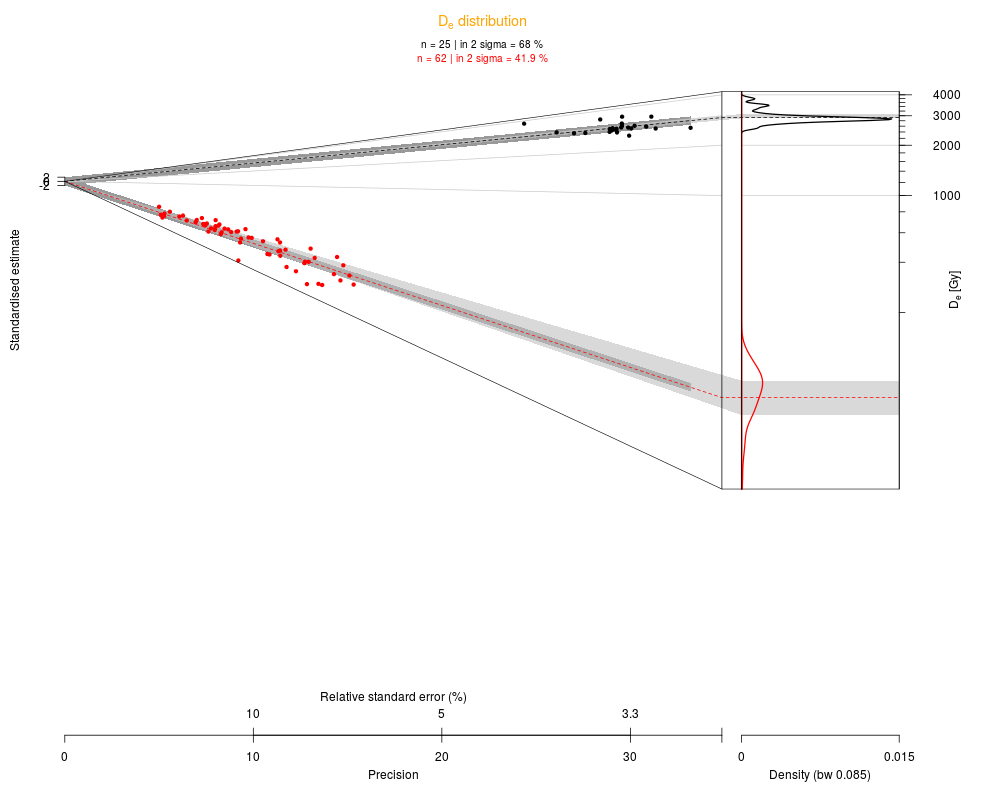
plot_AbanicoPlot(data = ExampleData.DeValues,
layout = layout.default)
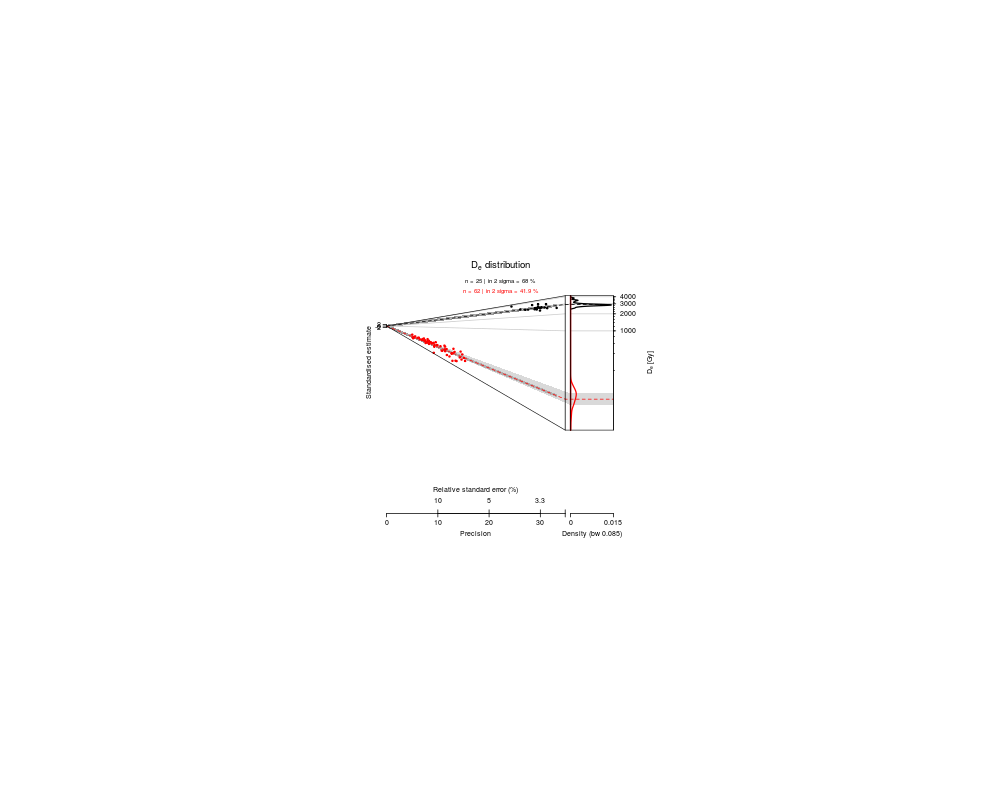
## create Abanico plot with predefined layout "journal"
plot_AbanicoPlot(data = ExampleData.DeValues,
layout = "journal")
Results
R version 3.3.1 (2016-06-21) -- "Bug in Your Hair"
Copyright (C) 2016 The R Foundation for Statistical Computing
Platform: x86_64-pc-linux-gnu (64-bit)

R is free software and comes with ABSOLUTELY NO WARRANTY.
You are welcome to redistribute it under certain conditions.
Type 'license()' or 'licence()' for distribution details.

R is a collaborative project with many contributors.
Type 'contributors()' for more information and
'citation()' on how to cite R or R packages in publications.

Type 'demo()' for some demos, 'help()' for on-line help, or
'help.start()' for an HTML browser interface to help.
Type 'q()' to quit R.

> library(Luminescence)
Welcome to the R package Luminescence version 0.6.0 [Built: 2016-05-30 16:47:30 UTC]
The authors of sTeve: 'We love to entertain you.'
> png(filename="/home/ddbj/snapshot/RGM3/R_CC/result/Luminescence/get_Layout.Rd_%03d_medium.png", width=480, height=480)
> ### Name: get_Layout
> ### Title: Collection of layout definitions
> ### Aliases: get_Layout
>
> ### ** Examples
>
>
> ## read example data set
> data(ExampleData.DeValues, envir = environment())
>
> ## show structure of the default layout definition
> layout.default <- get_Layout(layout = "default")
> str(layout.default)
List of 2
 $ abanico:List of 5
  ..$ font.type:List of 14
  .. ..$ main   : chr ""
  .. ..$ xlab1  : chr ""
  .. ..$ xlab2  : chr ""
  .. ..$ ylab   : chr ""
  .. ..$ zlab   : chr ""
  .. ..$ xtck1  : chr ""
  .. ..$ xtck2  : chr ""
  .. ..$ xtck3  : chr ""
  .. ..$ ytck   : chr ""
  .. ..$ ztck   : chr ""
  .. ..$ mtext  : chr ""
  .. ..$ summary: chr ""
  .. ..$ stats  : chr ""
  .. ..$ legend : chr ""
  ..$ font.size:List of 15
  .. ..$ main   : num 12
  .. ..$ xlab1  : num 12
  .. ..$ xlab2  : num 12
  .. ..$ xlab3  : num 12
  .. ..$ ylab   : num 12
  .. ..$ zlab   : num 12
  .. ..$ xtck1  : num 12
  .. ..$ xtck2  : num 12
  .. ..$ xtck3  : num 12
  .. ..$ ytck   : num 12
  .. ..$ ztck   : num 12
  .. ..$ mtext  : num 10
  .. ..$ summary: num 10
  .. ..$ stats  : num 10
  .. ..$ legend : num 10
  ..$ font.deco:List of 15
  .. ..$ main   : chr "bold"
  .. ..$ xlab1  : chr "normal"
  .. ..$ xlab2  : chr "normal"
  .. ..$ xlab3  : chr "normal"
  .. ..$ ylab   : chr "normal"
  .. ..$ zlab   : chr "normal"
  .. ..$ xtck1  : chr "normal"
  .. ..$ xtck2  : chr "normal"
  .. ..$ xtck3  : chr "normal"
  .. ..$ ytck   : chr "normal"
  .. ..$ ztck   : chr "normal"
  .. ..$ mtext  : chr "normal"
  .. ..$ summary: chr "normal"
  .. ..$ stats  : chr "normal"
  .. ..$ legend : chr "normal"
  ..$ colour   :List of 29
  .. ..$ main      : num 1
  .. ..$ xlab1     : num 1
  .. ..$ xlab2     : num 1
  .. ..$ xlab3     : num 1
  .. ..$ ylab      : num 1
  .. ..$ zlab      : num 1
  .. ..$ xtck1     : num 1
  .. ..$ xtck2     : num 1
  .. ..$ xtck3     : num 1
  .. ..$ ytck      : num 1
  .. ..$ ztck      : num 1
  .. ..$ mtext     : num 1
  .. ..$ summary   : num 1
  .. ..$ stats     : num 1
  .. ..$ legend    : num 1
  .. ..$ centrality: num 1
  .. ..$ value.dot : num 1
  .. ..$ value.bar : num 1
  .. ..$ value.rug : num 1
  .. ..$ poly.line : logi NA
  .. ..$ poly.fill : chr "#BFBFBF99"
  .. ..$ bar.line  : logi NA
  .. ..$ bar.fill  : chr "grey60"
  .. ..$ kde.line  : num 1
  .. ..$ kde.fill  : logi NA
  .. ..$ grid.major: chr "grey80"
  .. ..$ grid.minor: chr "none"
  .. ..$ border    : num 1
  .. ..$ background: logi NA
  ..$ dimension:List of 22
  .. ..$ figure.width : chr "auto"
  .. ..$ figure.height: chr "auto"
  .. ..$ margin       : num [1:4] 10 10 10 10
  .. ..$ main.line    : num 100
  .. ..$ xlab1.line   : num 90
  .. ..$ xlab2.line   : num 90
  .. ..$ xlab3.line   : num 90
  .. ..$ ylab.line    : num 100
  .. ..$ zlab.line    : num 70
  .. ..$ xtck1.line   : num 100
  .. ..$ xtck2.line   : num 100
  .. ..$ xtck3.line   : num 100
  .. ..$ ytck.line    : num 100
  .. ..$ ztck.line    : num 100
  .. ..$ xtcl1        : num 100
  .. ..$ xtcl2        : num 100
  .. ..$ xtcl3        : num 100
  .. ..$ ytcl         : num 100
  .. ..$ ztcl         : num 100
  .. ..$ rugl         : num 100
  .. ..$ mtext        : num 100
  .. ..$ summary.line : num 100
 $ kde    :List of 5
  ..$ font.type:List of 9
  .. ..$ main  : chr ""
  .. ..$ xlab  : chr ""
  .. ..$ ylab1 : chr ""
  .. ..$ ylab2 : chr ""
  .. ..$ xtck  : chr ""
  .. ..$ ytck1 : chr ""
  .. ..$ ytck2 : chr ""
  .. ..$ stats : chr ""
  .. ..$ legend: chr ""
  ..$ font.size:List of 9
  .. ..$ main  : num 14
  .. ..$ xlab  : num 12
  .. ..$ ylab1 : num 12
  .. ..$ ylab2 : num 12
  .. ..$ xtck  : num 12
  .. ..$ ytck1 : num 12
  .. ..$ ytck2 : num 12
  .. ..$ stats : num 12
  .. ..$ legend: num 12
  ..$ font.deco:List of 9
  .. ..$ main  : chr "bold"
  .. ..$ xlab  : chr "normal"
  .. ..$ ylab1 : chr "normal"
  .. ..$ ylab2 : chr "normal"
  .. ..$ xtck  : chr "normal"
  .. ..$ ytck1 : chr "normal"
  .. ..$ ytck2 : chr "normal"
  .. ..$ stats : chr "normal"
  .. ..$ legend: chr "normal"
  ..$ colour   :List of 19
  .. ..$ main      : num 1
  .. ..$ xlab      : num 1
  .. ..$ ylab1     : num 1
  .. ..$ ylab2     : num 1
  .. ..$ xtck      : num 1
  .. ..$ ytck1     : num 1
  .. ..$ ytck2     : num 1
  .. ..$ box       : num 1
  .. ..$ mtext     : num 2
  .. ..$ stats     : chr "#2062B3"
  .. ..$ kde.line  : chr "#2062B3"
  .. ..$ kde.fill  : NULL
  .. ..$ value.dot : num 1
  .. ..$ value.bar : num 1
  .. ..$ value.rug : num 1
  .. ..$ boxplot   : num 1
  .. ..$ mean.point: num 1
  .. ..$ sd.line   : num 1
  .. ..$ background: NULL
  ..$ dimension:List of 14
  .. ..$ figure.width : chr "auto"
  .. ..$ figure.height: chr "auto"
  .. ..$ margin       : num [1:4] 10 10 10 10
  .. ..$ main.line    : num 100
  .. ..$ xlab.line    : num 100
  .. ..$ ylab1.line   : num 100
  .. ..$ ylab2.line   : num 100
  .. ..$ xtck.line    : num 100
  .. ..$ ytck1.line   : num 100
  .. ..$ ytck2.line   : num 100
  .. ..$ xtcl         : num 100
  .. ..$ ytcl1        : num 100
  .. ..$ ytcl2        : num 100
  .. ..$ stats.line   : num 100
>
> ## show colour definitions for Abanico plot, only
> layout.default$abanico$colour
$main
[1] 1

$xlab1
[1] 1

$xlab2
[1] 1

$xlab3
[1] 1

$ylab
[1] 1

$zlab
[1] 1

$xtck1
[1] 1

$xtck2
[1] 1

$xtck3
[1] 1

$ytck
[1] 1

$ztck
[1] 1

$mtext
[1] 1

$summary
[1] 1

$stats
[1] 1

$legend
[1] 1

$centrality
[1] 1

$value.dot
[1] 1

$value.bar
[1] 1

$value.rug
[1] 1

$poly.line
[1] NA

$poly.fill
[1] "#BFBFBF99"

$bar.line
[1] NA

$bar.fill
[1] "grey60"

$kde.line
[1] 1

$kde.fill
[1] NA

$grid.major
[1] "grey80"

$grid.minor
[1] "none"

$border
[1] 1

$background
[1] NA

>
> ## set Abanico plot title colour to orange
> layout.default$abanico$colour$main <- "orange"
>
> ## create Abanico plot with modofied layout definition
> plot_AbanicoPlot(data = ExampleData.DeValues,
+                  layout = layout.default)
>
> ## create Abanico plot with predefined layout "journal"
> plot_AbanicoPlot(data = ExampleData.DeValues,
+                  layout = "journal")
>
>
>
>
>
>
> dev.off()
null device
          1
>
|