Supported by Dr. Osamu Ogasawara and  . . |
|
Last data update: 2014.03.03 |
Plot function for an RLum.Analysis S4 class objectDescriptionThe function provides a standardised plot output for curve data of an RLum.Analysis S4 class object Usageplot_RLum.Analysis(object, subset, nrows, ncols, abline = NULL, combine = FALSE, curve.transformation, plot.single = FALSE, ...) Arguments
DetailsThe function produces a multiple plot output. A file output is recommended
(e.g., curve.transformation This argument allows transforming continuous wave (CW) curves to pseudo
(linear) modulated curves. For the transformation, the functions of the
package are used. Currently, it is not possible to pass further arguments to
the transformation functions. The argument works only for Please note: The curve transformation within this functions works roughly,
i.e. every IRSL or OSL curve is transformed, without considerung whether it
is measured with the PMT or not! However, for a fast look it might be
helpful. ValueReturns multiple plots. Function version0.3.6 (2016-05-02 09:41:37) NoteNot all arguments available for Author(s)Sebastian Kreutzer, IRAMAT-CRP2A, Universite Bordeaux Montaigne
(France)
References# See Also
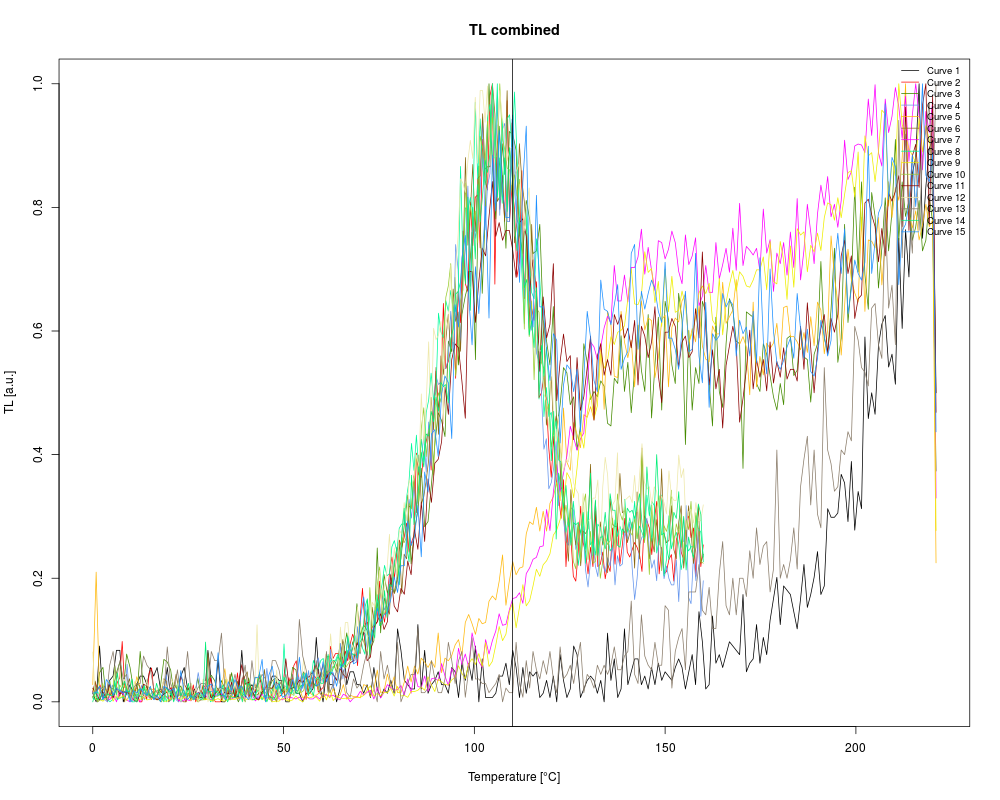
Examples##load data data(ExampleData.BINfileData, envir = environment()) ##convert values for position 1 temp <- Risoe.BINfileData2RLum.Analysis(CWOSL.SAR.Data, pos=1) ##plot (combine) TL curves in one plot plot_RLum.Analysis( temp, subset = list(recordType = "TL"), combine = TRUE, norm = TRUE, abline = list(v = c(110)) ) Results
R version 3.3.1 (2016-06-21) -- "Bug in Your Hair"
Copyright (C) 2016 The R Foundation for Statistical Computing
Platform: x86_64-pc-linux-gnu (64-bit)

R is free software and comes with ABSOLUTELY NO WARRANTY.
You are welcome to redistribute it under certain conditions.
Type 'license()' or 'licence()' for distribution details.

R is a collaborative project with many contributors.
Type 'contributors()' for more information and
'citation()' on how to cite R or R packages in publications.

Type 'demo()' for some demos, 'help()' for on-line help, or
'help.start()' for an HTML browser interface to help.
Type 'q()' to quit R.

> library(Luminescence)
Welcome to the R package Luminescence version 0.6.0 [Built: 2016-05-30 16:47:30 UTC]
The answer to life, the universe and everything: 'get_rightAnswer()'
> png(filename="/home/ddbj/snapshot/RGM3/R_CC/result/Luminescence/plot_RLum.Analysis.Rd_%03d_medium.png", width=480, height=480)
> ### Name: plot_RLum.Analysis
> ### Title: Plot function for an RLum.Analysis S4 class object
> ### Aliases: plot_RLum.Analysis
> ### Keywords: aplot
>
> ### ** Examples
>
>
> ##load data
> data(ExampleData.BINfileData, envir = environment())
>
> ##convert values for position 1
> temp <- Risoe.BINfileData2RLum.Analysis(CWOSL.SAR.Data, pos=1)
>
> ##plot (combine) TL curves in one plot
> plot_RLum.Analysis(
+ temp,
+ subset = list(recordType = "TL"),
+ combine = TRUE,
+ norm = TRUE,
+ abline = list(v = c(110))
+ )
>
>
>
>
>
>
> dev.off()
null device
          1
>
|