Supported by Dr. Osamu Ogasawara and  . . |
|
Last data update: 2014.03.03 |
Plot function for an
|
object |
|
par.local |
|
plot.type |
|
... |
further arguments and graphical parameters that will be passed to the specific plot functions. |
Details
Details on the plot functions
Image is visualised as 2D plot usinng generic plot types provided by other packages.
Supported plot types:
plot.type = "plot.raster"
Uses the standard plot function for raster data from the package
raster: plot. For each raster layer in a
raster brick one plot is produced.
Arguments that are passed through the function call:
main,axes, xlab, ylab, xlim, ylim,
col
plot.type = "plotRGB"
Uses the function plotRGB from the
raster package. Only one image plot is produced as all layers
in a brick a combined. This plot type is useful to see whether any signal
is recorded by the camera.
Arguments that are passed through the function
call:
main,axes, xlab, ylab, ext,
interpolate, maxpixels, alpha, colNA,
stretch
plot.type = "contour"
Uses the function contour plot function from the raster
function (contour). For each raster layer one contour
plot is produced. Arguments that are passed through the function call:
main,axes, xlab, ylab, xlim, ylim,
col
Value
Returns a plot.
Function version
0.1 (2015-11-29 17:27:48)
Note
This function has been created to faciliate the plotting of image data
imported by the function read_SPE2R. However, so far the
function is not optimized to handle image data > ca. 200 MByte and thus
plotting of such data is extremely slow.
Author(s)
Sebastian Kreutzer, IRAMAT-CRP2A, Universite Bordeaux Montaigne
(France)
R Luminescence Package Team
References
-
See Also
RLum.Data.Image, plot,
plot_RLum, raster,
Examples
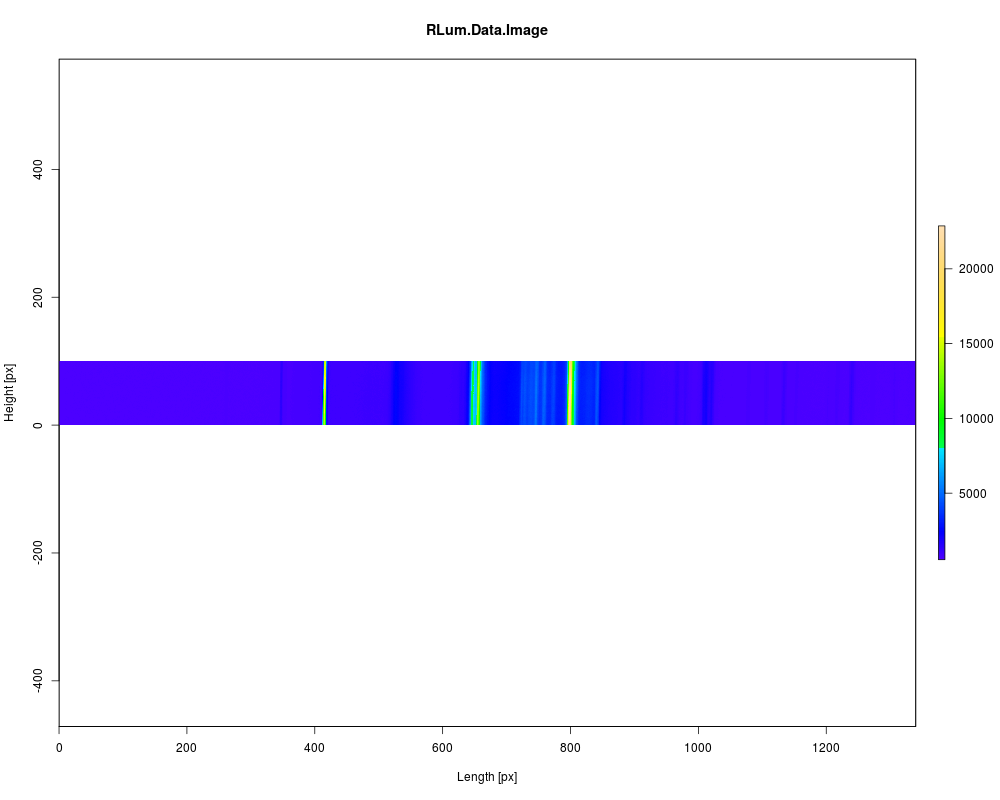
##load data
data(ExampleData.RLum.Data.Image, envir = environment())

##plot data
plot_RLum.Data.Image(ExampleData.RLum.Data.Image)
Results
R version 3.3.1 (2016-06-21) -- "Bug in Your Hair"
Copyright (C) 2016 The R Foundation for Statistical Computing
Platform: x86_64-pc-linux-gnu (64-bit)

R is free software and comes with ABSOLUTELY NO WARRANTY.
You are welcome to redistribute it under certain conditions.
Type 'license()' or 'licence()' for distribution details.

R is a collaborative project with many contributors.
Type 'contributors()' for more information and
'citation()' on how to cite R or R packages in publications.

Type 'demo()' for some demos, 'help()' for on-line help, or
'help.start()' for an HTML browser interface to help.
Type 'q()' to quit R.

> library(Luminescence)
Welcome to the R package Luminescence version 0.6.0 [Built: 2016-05-30 16:47:30 UTC]
An unbiased reviewer: 'The data is too poor to be published in QG, try a higher ranked journal.'
> png(filename="/home/ddbj/snapshot/RGM3/R_CC/result/Luminescence/plot_RLum.Data.Image.Rd_%03d_medium.png", width=480, height=480)
> ### Name: plot_RLum.Data.Image
> ### Title: Plot function for an 'RLum.Data.Image' S4 class object
> ### Aliases: plot_RLum.Data.Image
> ### Keywords: aplot
>
> ### ** Examples
>
>
>
> ##load data
> data(ExampleData.RLum.Data.Image, envir = environment())
>
> ##plot data
> plot_RLum.Data.Image(ExampleData.RLum.Data.Image)
>
>
>
>
>
>
> dev.off()
null device
          1
>
|