Supported by Dr. Osamu Ogasawara and  . . |
|
Last data update: 2014.03.03 |
Plot function for an RLum.Results S4 class objectDescriptionThe function provides a standardised plot output for data of an RLum.Results S4 class object Usageplot_RLum.Results(object, single = TRUE, ...) Arguments
DetailsThe function produces a multiple plot output. A file output is recommended
(e.g., ValueReturns multiple plots. Function version0.2.1 (2016-05-16 22:24:15) NoteNot all arguments available for Author(s)Christoph Burow, University of Cologne (Germany), Sebastian Kreutzer, IRAMAT-CRP2A,
Universite Bordeaux Montaigne (France)
References# See Also
Examples###load data data(ExampleData.DeValues, envir = environment()) # apply the un-logged minimum age model mam <- calc_MinDose(data = ExampleData.DeValues$CA1, sigmab = 0.2, log = TRUE, plot = FALSE) ##plot plot_RLum.Results(mam) # estimate the number of grains on an aliquot grains<- calc_AliquotSize(grain.size = c(100,150), sample.diameter = 1, plot = FALSE, MC.iter = 100) ##plot plot_RLum.Results(grains) Results
R version 3.3.1 (2016-06-21) -- "Bug in Your Hair"
Copyright (C) 2016 The R Foundation for Statistical Computing
Platform: x86_64-pc-linux-gnu (64-bit)
R is free software and comes with ABSOLUTELY NO WARRANTY.
You are welcome to redistribute it under certain conditions.
Type 'license()' or 'licence()' for distribution details.
R is a collaborative project with many contributors.
Type 'contributors()' for more information and
'citation()' on how to cite R or R packages in publications.
Type 'demo()' for some demos, 'help()' for on-line help, or
'help.start()' for an HTML browser interface to help.
Type 'q()' to quit R.
> library(Luminescence)
Welcome to the R package Luminescence version 0.6.0 [Built: 2016-05-30 16:47:30 UTC]
A common luminescence reader customer: 'If anything can go wrong, it will.'
> png(filename="/home/ddbj/snapshot/RGM3/R_CC/result/Luminescence/plot_RLum.Results.Rd_%03d_medium.png", width=480, height=480)
> ### Name: plot_RLum.Results
> ### Title: Plot function for an RLum.Results S4 class object
> ### Aliases: plot_RLum.Results
> ### Keywords: aplot
>
> ### ** Examples
>
>
>
> ###load data
> data(ExampleData.DeValues, envir = environment())
>
> # apply the un-logged minimum age model
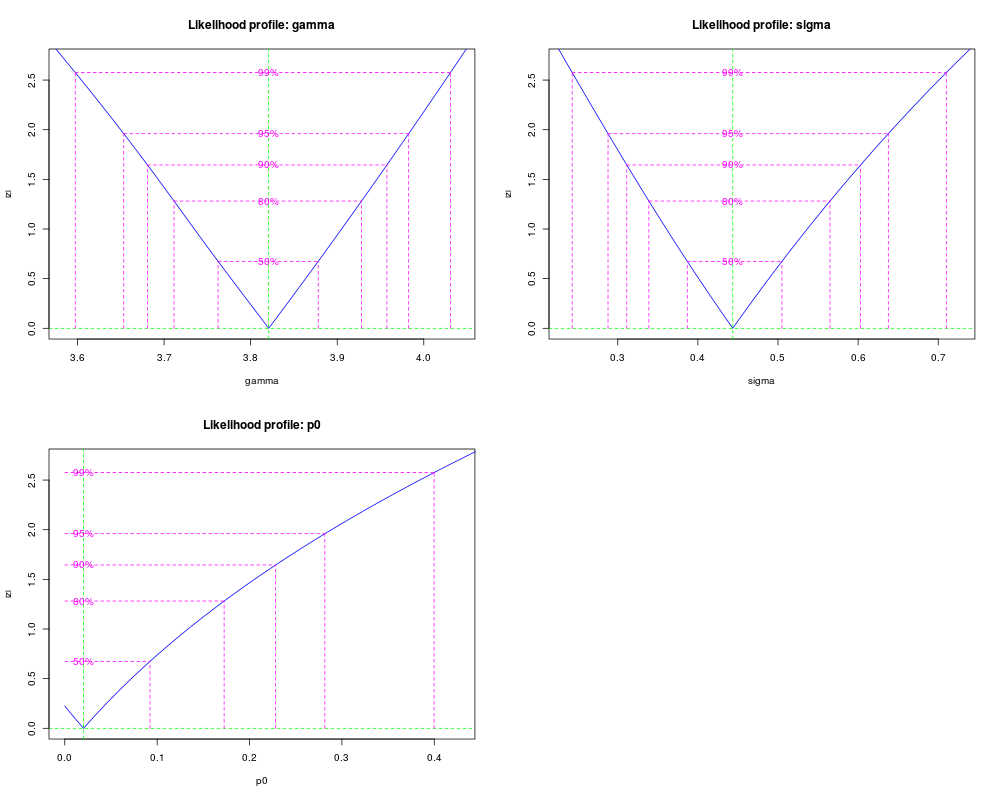
> mam <- calc_MinDose(data = ExampleData.DeValues$CA1, sigmab = 0.2, log = TRUE, plot = FALSE)
----------- meta data -----------
n par sigmab logged Lmax BIC
62 3 0.2 TRUE -32.43138 84.14389
--- final parameter estimates ---
gamma sigma p0 mu
3.82 0.44 0.02 0
------ confidence intervals -----
2.5 % 97.5 %
gamma 3.65 3.98
sigma 0.29 0.64
p0 NA 0.28
------ De (asymmetric error) -----
De lower upper
45.64 38.61 53.65
------ De (symmetric error) -----
De error
45.64 3.84
>
> ##plot
> plot_RLum.Results(mam)
>
> # estimate the number of grains on an aliquot
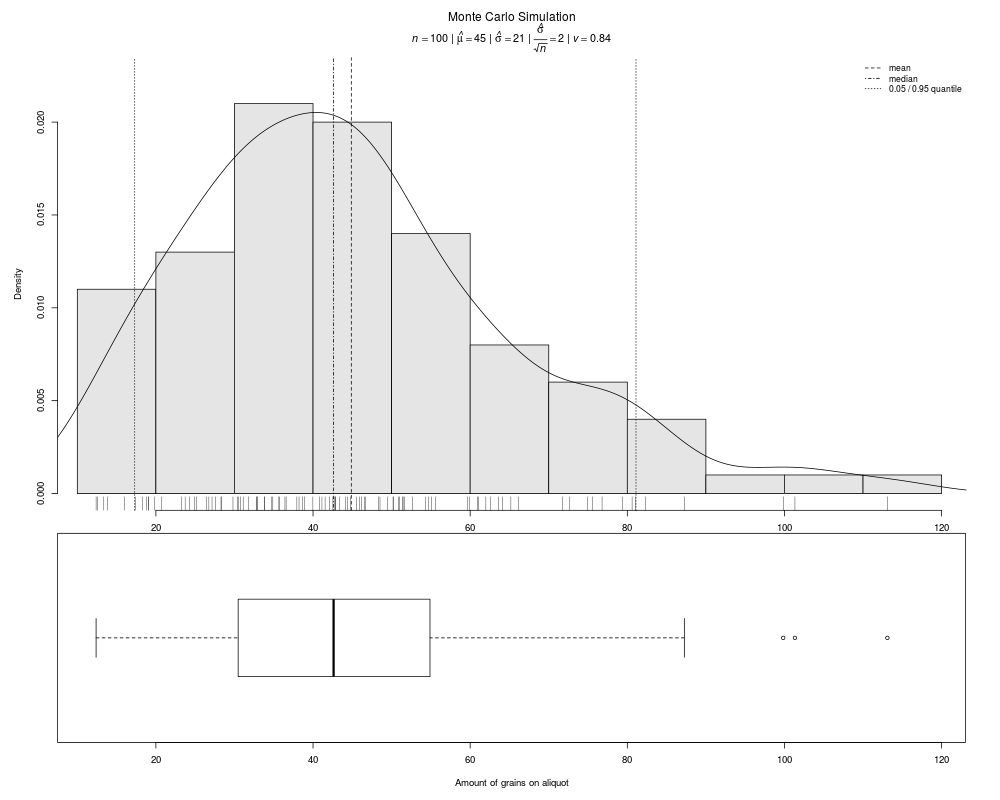
> grains<- calc_AliquotSize(grain.size = c(100,150), sample.diameter = 1, plot = FALSE, MC.iter = 100)
[calc_AliquotSize]
---------------------------------------------------------
mean grain size (microns) : 125
sample diameter (mm) : 1
packing density : 0.65
number of grains : 42
--------------- Monte Carlo Estimates -------------------
number of iterations (n) : 100
median : 43
mean : 45
standard deviation (mean) : 21
standard error (mean) : 2.1
95% CI from t-test (mean) : 41 - 49
standard error from CI (mean): 2.1
---------------------------------------------------------
>
> ##plot
> plot_RLum.Results(grains)
>
>
>
>
>
>
>
> dev.off()
null device
1
>
|