Supported by Dr. Osamu Ogasawara and  . . |
|
Last data update: 2014.03.03 |
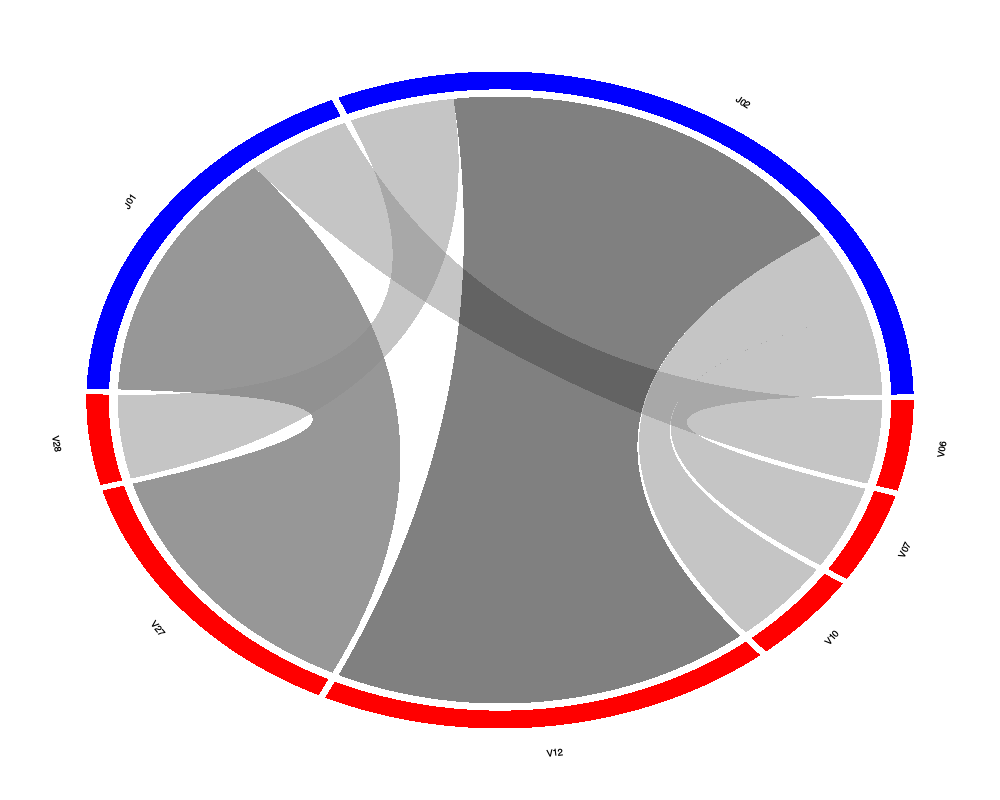
Chord diagram of VJ or DJ gene associationsDescriptionCreates a chord diagram showing VJ or DJ gene associations from one or more samples. Usage
chordDiagramVDJ(sample, association = "VJ", colors = c("red", "blue"))
Arguments
DetailsThe size of the ribbons connecting VJ or DJ genes correspond to the number of samples or number of sequences that make up that recombination event. The thicker the ribbon, the higher the frequency of the recombination. ValueReturns a chord diagram showing VJ or DJ gene associations from one or more samples. See Also
Examples
file.path <- system.file("extdata", "TCRB_sequencing", package = "LymphoSeq")

file.list <- readImmunoSeq(path = file.path)

productive.nt <- productiveSeq(file.list = file.list, aggregate = "nucleotide")

top.seqs <- topSeqs(productive.seqs = productive.nt, top = 1)

chordDiagramVDJ(sample = top.seqs, association = "VJ", colors = c("red", "blue"))

# Remove "TCRB" from gene family name
top.seqs <- as.data.frame(apply(top.seqs, 2, function(x) gsub("TCRB", "", x)))

chordDiagramVDJ(sample = top.seqs, association = "VJ", colors = c("red", "blue"))
Results
R version 3.3.1 (2016-06-21) -- "Bug in Your Hair"
Copyright (C) 2016 The R Foundation for Statistical Computing
Platform: x86_64-pc-linux-gnu (64-bit)

R is free software and comes with ABSOLUTELY NO WARRANTY.
You are welcome to redistribute it under certain conditions.
Type 'license()' or 'licence()' for distribution details.

R is a collaborative project with many contributors.
Type 'contributors()' for more information and
'citation()' on how to cite R or R packages in publications.

Type 'demo()' for some demos, 'help()' for on-line help, or
'help.start()' for an HTML browser interface to help.
Type 'q()' to quit R.

> library(LymphoSeq)
Loading required package: LymphoSeqDB
> png(filename="/home/ddbj/snapshot/RGM3/R_BC/result/LymphoSeq/chordDiagramVDJ.Rd_%03d_medium.png", width=480, height=480)
> ### Name: chordDiagramVDJ
> ### Title: Chord diagram of VJ or DJ gene associations
> ### Aliases: chordDiagramVDJ
>
> ### ** Examples
>
> file.path <- system.file("extdata", "TCRB_sequencing", package = "LymphoSeq")
>
> file.list <- readImmunoSeq(path = file.path)
   |                                                                               |                                                                      |   0%   |                                                                               |======                                                                |   9%   |                                                                               |=============                                                         |  18%   |                                                                               |===================                                                   |  27%   |                                                                               |=========================                                             |  36%   |                                                                               |================================                                      |  45%   |                                                                               |======================================                                |  55%   |                                                                               |=============================================                         |  64%   |                                                                               |===================================================                   |  73%   |                                                                               |=========================================================             |  82%   |                                                                               |================================================================      |  91%   |                                                                               |======================================================================| 100%
>
> productive.nt <- productiveSeq(file.list = file.list, aggregate = "nucleotide")
   |                                                                               |                                                                      |   0%   |                                                                               |======                                                                |   9%   |                                                                               |=============                                                         |  18%   |                                                                               |===================                                                   |  27%   |                                                                               |=========================                                             |  36%   |                                                                               |================================                                      |  45%   |                                                                               |======================================                                |  55%   |                                                                               |=============================================                         |  64%   |                                                                               |===================================================                   |  73%   |                                                                               |=========================================================             |  82%   |                                                                               |================================================================      |  91%   |                                                                               |======================================================================| 100%
>
> top.seqs <- topSeqs(productive.seqs = productive.nt, top = 1)
>
> chordDiagramVDJ(sample = top.seqs, association = "VJ", colors = c("red", "blue"))
>
> # Remove "TCRB" from gene family name
> top.seqs <- as.data.frame(apply(top.seqs, 2, function(x) gsub("TCRB", "", x)))
>
> chordDiagramVDJ(sample = top.seqs, association = "VJ", colors = c("red", "blue"))
>
>
>
>
>
> dev.off()
null device
          1
>
|