Supported by Dr. Osamu Ogasawara and  . . |
|
Last data update: 2014.03.03 |
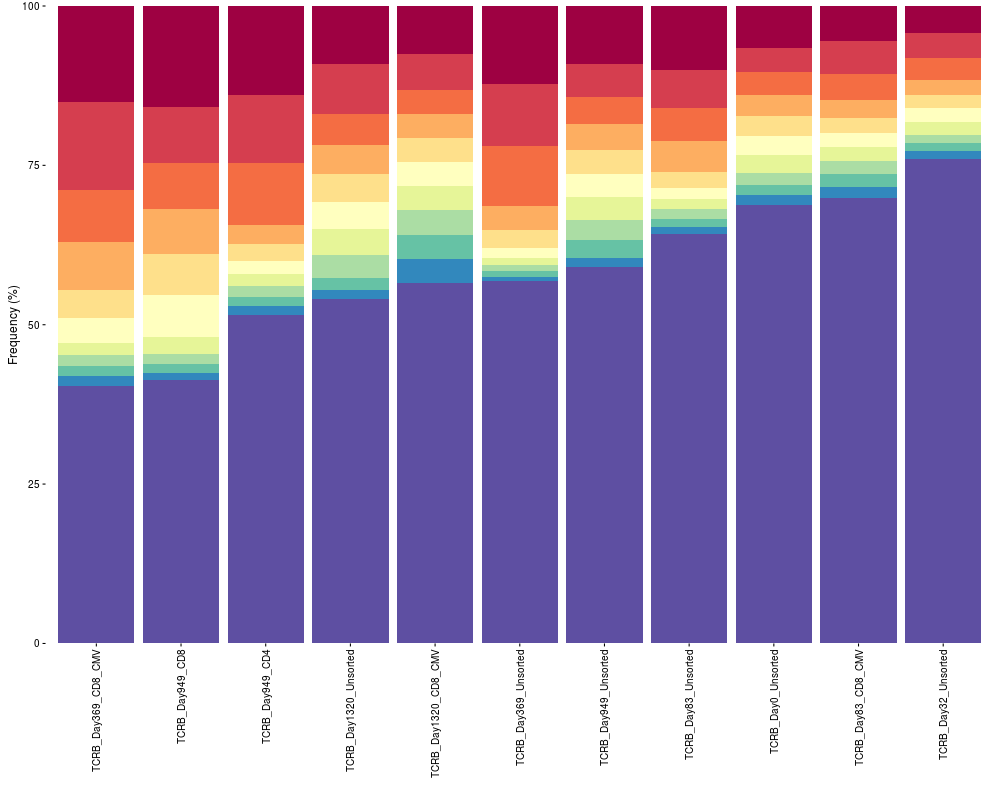
Cumulative frequency bar plot of top sequencesDescriptionCreate a cumulative frequency bar plot of a specified number of top sequences. UsagetopSeqsPlot(list, top = 10) Arguments
DetailsThe plot is made using the package ggplot2 and can be reformatted using ggplot2 functions. See examples below. ValueReturns a cumulative frequency bar plot of the top sequences. See AlsoAn excellent resource for examples on how to reformat a ggplot can be found in the R Graphics Cookbook online (http://www.cookbook-r.com/Graphs/). Examples
file.path <- system.file("extdata", "TCRB_sequencing", package = "LymphoSeq")
file.list <- readImmunoSeq(path = file.path)
topSeqsPlot(list = file.list, top = 10)
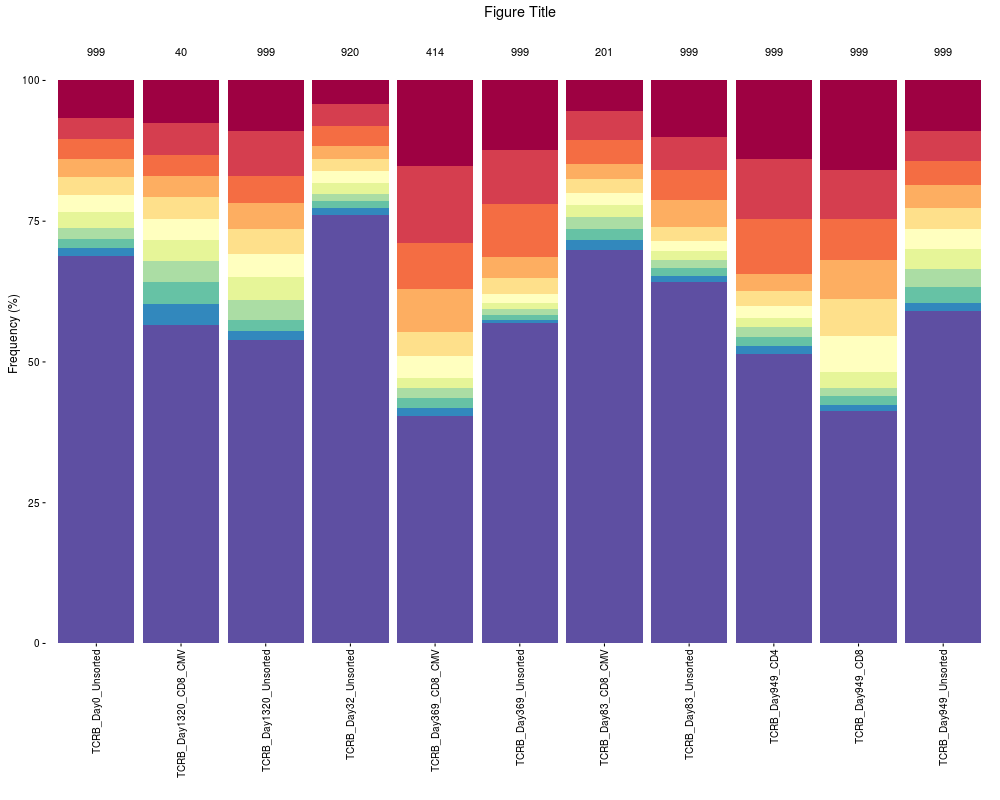
# Display the number of sequences at the top of bar plot and add a title
n <- as.character(lapply(file.list, nrow))
topSeqsPlot(list = file.list, top = 10) +
ggplot2::annotate("text", x = 1:length(file.list), y = 105, label = n, color = "black") +
ggplot2::expand_limits(y = c(0, 110)) + ggplot2::ggtitle("Figure Title") +
ggplot2::scale_x_discrete(limits = names(file.list))
Results
R version 3.3.1 (2016-06-21) -- "Bug in Your Hair"
Copyright (C) 2016 The R Foundation for Statistical Computing
Platform: x86_64-pc-linux-gnu (64-bit)

R is free software and comes with ABSOLUTELY NO WARRANTY.
You are welcome to redistribute it under certain conditions.
Type 'license()' or 'licence()' for distribution details.

R is a collaborative project with many contributors.
Type 'contributors()' for more information and
'citation()' on how to cite R or R packages in publications.

Type 'demo()' for some demos, 'help()' for on-line help, or
'help.start()' for an HTML browser interface to help.
Type 'q()' to quit R.

> library(LymphoSeq)
Loading required package: LymphoSeqDB
> png(filename="/home/ddbj/snapshot/RGM3/R_BC/result/LymphoSeq/topSeqsPlot.Rd_%03d_medium.png", width=480, height=480)
> ### Name: topSeqsPlot
> ### Title: Cumulative frequency bar plot of top sequences
> ### Aliases: topSeqsPlot
>
> ### ** Examples
>
> file.path <- system.file("extdata", "TCRB_sequencing", package = "LymphoSeq")
>
> file.list <- readImmunoSeq(path = file.path)
   |                                                                               |                                                                      |   0%   |                                                                               |======                                                                |   9%   |                                                                               |=============                                                         |  18%   |                                                                               |===================                                                   |  27%   |                                                                               |=========================                                             |  36%   |                                                                               |================================                                      |  45%   |                                                                               |======================================                                |  55%   |                                                                               |=============================================                         |  64%   |                                                                               |===================================================                   |  73%   |                                                                               |=========================================================             |  82%   |                                                                               |================================================================      |  91%   |                                                                               |======================================================================| 100%
>
> topSeqsPlot(list = file.list, top = 10)
>
> # Display the number of sequences at the top of bar plot and add a title
> n <- as.character(lapply(file.list, nrow))
>
> topSeqsPlot(list = file.list, top = 10) +
+    ggplot2::annotate("text", x = 1:length(file.list), y = 105, label = n, color = "black") +
+    ggplot2::expand_limits(y = c(0, 110)) + ggplot2::ggtitle("Figure Title") +
+    ggplot2::scale_x_discrete(limits = names(file.list))
Scale for 'x' is already present. Adding another scale for 'x', which will
replace the existing scale.
>
>
>
>
>
> dev.off()
null device
          1
>
|
Created & Maintained by Osamu Ogasawara (osamu.ogasawara@gmail.com) and 