Supported by Dr. Osamu Ogasawara and  . . |
|
Last data update: 2014.03.03 |
Obtain map boundaries for Canada, USA, and MexicoDescriptionObtain map boundaries of Canada, USA, and Mexico, including state boundaries, in longitude/latitude. Usageget.canusamex.bds() DetailsThis function depends on the maps and mapdata
packages to get the appropriate map boundary lines. The function uses
the high-resolution boundaries (“worldHires” database) in the
mapdata to find the coastlines and national boundaries for
Canada, the USA, and Mexico. Then, it appends the state boundaries
(in “state” from the maps package), removing the
coastlines and national boundaries so that they don't conflict with
the higher-resolution ones (from “worldHires”). This allows the
user to draw the national and state boundaries with high-resolution
and without with conflicting boundaries yielded by the “world”
database. This function is intended to be called by the function
ValueMatrix specifying the polylines needed to plot the national (Canada, USA, Mexico) and state outlines. This matrix has two columns, with longitude in the first column and latitude in the second. Author(s)Jenise Swall See Also
Examples
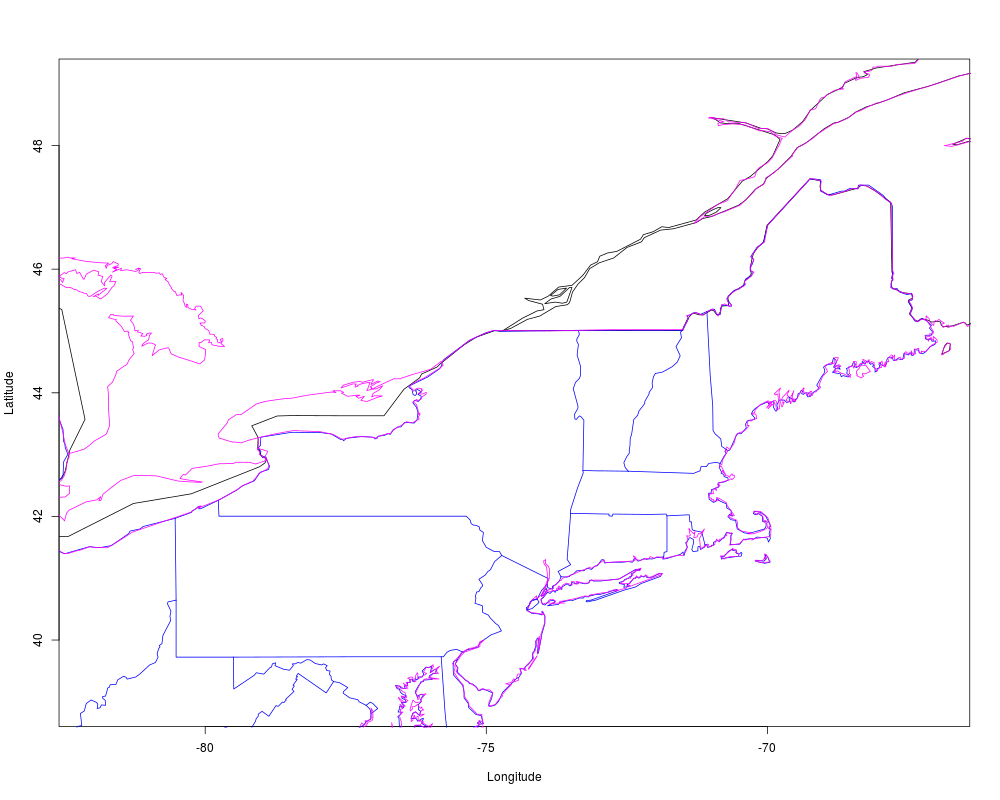
## Set up a plotting region (in longitude/latitude) that includes an
## eastern portion of the Canada/USA border.
plot(c(-82,-67), c(39,49), type="n", xlab="Longitude", ylab="Latitude")
## Superimpose national boundaries from "world" database, which is
## fairly low-resolution (since it includes worldwide national boundaries).
map("world", regions="canada", add=TRUE)
## Now, if we try to superimpose the the USA state boundaries from the
## higher resolution "state" database, we have a conflict.  (See
## particularly the Maine border.)
map("state", add=TRUE, col="blue")
## The high-resolution national boundaries in database "worldHires" (in
## mapdata) also don't match up with the state lines.
map("worldHires", add=TRUE, col="magenta")

## Instead, we get the national boundaries (Canada, USA, Mexico) at
## high-resolution from database "worldHires" and the state boundaries
## (without the coastlines and national boundaries) from the "state"
## database.
dev.new()
plot(c(-82,-67), c(39,49), type="n", xlab="Longitude", ylab="Latitude")
lines(get.canusamex.bds())
Results
R version 3.3.1 (2016-06-21) -- "Bug in Your Hair"
Copyright (C) 2016 The R Foundation for Statistical Computing
Platform: x86_64-pc-linux-gnu (64-bit)

R is free software and comes with ABSOLUTELY NO WARRANTY.
You are welcome to redistribute it under certain conditions.
Type 'license()' or 'licence()' for distribution details.

R is a collaborative project with many contributors.
Type 'contributors()' for more information and
'citation()' on how to cite R or R packages in publications.

Type 'demo()' for some demos, 'help()' for on-line help, or
'help.start()' for an HTML browser interface to help.
Type 'q()' to quit R.

> library(M3)
Loading required package: ncdf4
Loading required package: rgdal
Loading required package: sp
rgdal: version: 1.1-10, (SVN revision 622)
 Geospatial Data Abstraction Library extensions to R successfully loaded
 Loaded GDAL runtime: GDAL 1.11.3, released 2015/09/16
 Path to GDAL shared files: /usr/share/gdal/1.11
 Loaded PROJ.4 runtime: Rel. 4.9.2, 08 September 2015, [PJ_VERSION: 492]
 Path to PROJ.4 shared files: (autodetected)
 Linking to sp version: 1.2-3
Loading required package: maps

 # maps v3.1: updated 'world': all lakes moved to separate new #
 # 'lakes' database. Type '?world' or 'news(package="maps")'.  #


Loading required package: mapdata
> png(filename="/home/ddbj/snapshot/RGM3/R_CC/result/M3/get.canusamex.bds.Rd_%03d_medium.png", width=480, height=480)
> ### Name: get.canusamex.bds
> ### Title: Obtain map boundaries for Canada, USA, and Mexico
> ### Aliases: get.canusamex.bds
>
> ### ** Examples
>
> ## Set up a plotting region (in longitude/latitude) that includes an
> ## eastern portion of the Canada/USA border.
> plot(c(-82,-67), c(39,49), type="n", xlab="Longitude", ylab="Latitude")
> ## Superimpose national boundaries from "world" database, which is
> ## fairly low-resolution (since it includes worldwide national boundaries).
> map("world", regions="canada", add=TRUE)
> ## Now, if we try to superimpose the the USA state boundaries from the
> ## higher resolution "state" database, we have a conflict.  (See
> ## particularly the Maine border.)
> map("state", add=TRUE, col="blue")
> ## The high-resolution national boundaries in database "worldHires" (in
> ## mapdata) also don't match up with the state lines.
> map("worldHires", add=TRUE, col="magenta")
>
> ## Instead, we get the national boundaries (Canada, USA, Mexico) at
> ## high-resolution from database "worldHires" and the state boundaries
> ## (without the coastlines and national boundaries) from the "state"
> ## database.
> dev.new()
Error in dev.new() : no suitable unused file name for pdf()
Execution halted
|