Supported by Dr. Osamu Ogasawara and  . . |
|
Last data update: 2014.03.03 |
Project coordinates based on projection in the first file to the projection given in the secondDescriptionProject coordinates based on projection in the first Models3-formatted file to the projection given in the second Models3-formatted file. Usageproject.M3.1.to.M3.2(x, y, from.file, to.file, units, ...) Arguments
DetailsThis function calls Value A list containing the elements WarningThis function assumes the projections in
Author(s)Jenise Swall ReferencesSee Also
Examples
## Find the path to a demo file with lambert conic conformal projection.
lcc.file <- system.file("extdata/ozone_lcc.ncf", package="M3")
## Read in the ozone for July 4 for eastern U.S.
lcc.oz <- get.M3.var(file=lcc.file, var="O3",
lcol=90, ucol=130, lrow=30, urow=80,
ldatetime=as.Date("2001-07-04"),
udatetime=as.Date("2001-07-04"))
## Get the cell centers for this subset.
east.ctrs <- expand.grid(lcc.oz$x.cell.ctr, lcc.oz$y.cell.ctr)
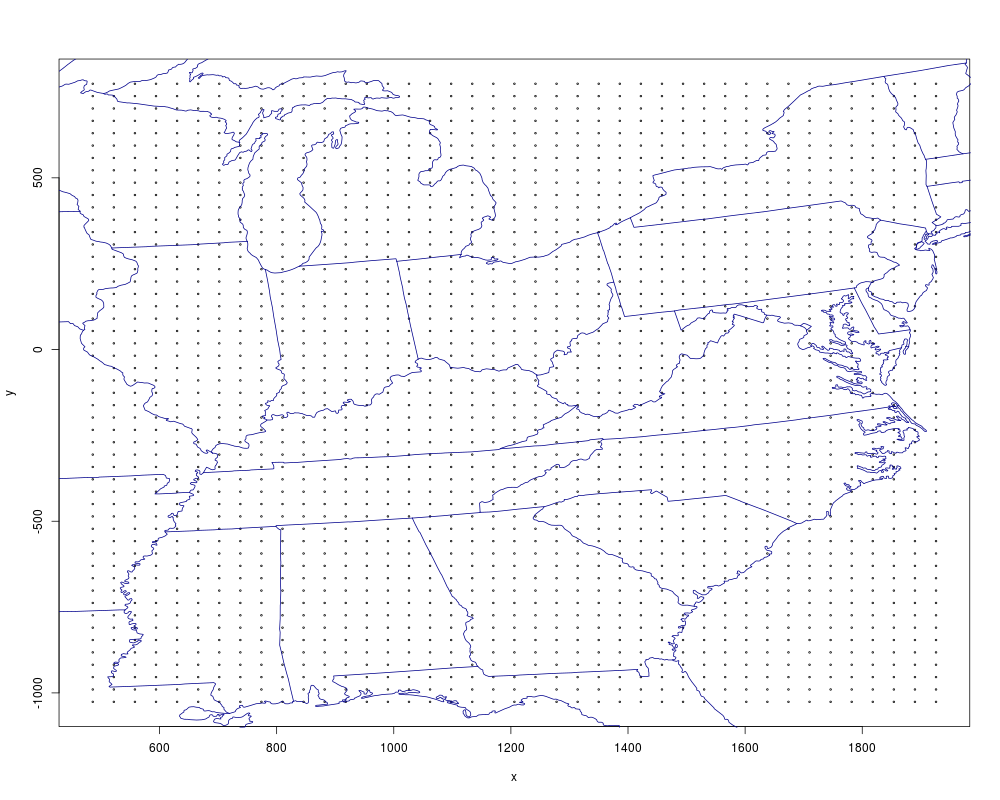
plot(east.ctrs, cex=0.3, xlab="x", ylab="y")
## Find map lines on this projection, superplot.
lcc.state.bds <- get.map.lines.M3.proj(file=lcc.file)$coords
lines(lcc.state.bds, col="darkblue")
## Find the path to a demo file with polar stereographic projection.
polar.file <- system.file("extdata/surfinfo_polar.ncf", package="M3")
## Put the cell centers from the subsetted ozone data on this polar
## stereographic projection.
polar.oz <- project.M3.1.to.M3.2(east.ctrs[,1], east.ctrs[,2],
from.file=lcc.file,
to.file=polar.file,
units=lcc.oz$hz.units)
## Plot the cells centers and boundary lines on the polar
## stereographic projection.
dev.new()
plot(polar.oz$coords)
polar.state.bds <- get.map.lines.M3.proj(file=polar.file)$coords
lines(polar.state.bds, col="darkblue")
Results
R version 3.3.1 (2016-06-21) -- "Bug in Your Hair"
Copyright (C) 2016 The R Foundation for Statistical Computing
Platform: x86_64-pc-linux-gnu (64-bit)

R is free software and comes with ABSOLUTELY NO WARRANTY.
You are welcome to redistribute it under certain conditions.
Type 'license()' or 'licence()' for distribution details.

R is a collaborative project with many contributors.
Type 'contributors()' for more information and
'citation()' on how to cite R or R packages in publications.

Type 'demo()' for some demos, 'help()' for on-line help, or
'help.start()' for an HTML browser interface to help.
Type 'q()' to quit R.

> library(M3)
Loading required package: ncdf4
Loading required package: rgdal
Loading required package: sp
rgdal: version: 1.1-10, (SVN revision 622)
 Geospatial Data Abstraction Library extensions to R successfully loaded
 Loaded GDAL runtime: GDAL 1.11.3, released 2015/09/16
 Path to GDAL shared files: /usr/share/gdal/1.11
 Loaded PROJ.4 runtime: Rel. 4.9.2, 08 September 2015, [PJ_VERSION: 492]
 Path to PROJ.4 shared files: (autodetected)
 Linking to sp version: 1.2-3
Loading required package: maps

 # maps v3.1: updated 'world': all lakes moved to separate new #
 # 'lakes' database. Type '?world' or 'news(package="maps")'.  #


Loading required package: mapdata
> png(filename="/home/ddbj/snapshot/RGM3/R_CC/result/M3/project.M3.1.to.M3.2.Rd_%03d_medium.png", width=480, height=480)
> ### Name: project.M3.1.to.M3.2
> ### Title: Project coordinates based on projection in the first file to the
> ###   projection given in the second
> ### Aliases: project.M3.1.to.M3.2
>
> ### ** Examples
>
> ## Find the path to a demo file with lambert conic conformal projection.
> lcc.file <- system.file("extdata/ozone_lcc.ncf", package="M3")
>
> ## Read in the ozone for July 4 for eastern U.S.
> lcc.oz <- get.M3.var(file=lcc.file, var="O3",
+                       lcol=90, ucol=130, lrow=30, urow=80,
+                       ldatetime=as.Date("2001-07-04"),
+                       udatetime=as.Date("2001-07-04"))
>
> ## Get the cell centers for this subset.
> east.ctrs <- expand.grid(lcc.oz$x.cell.ctr, lcc.oz$y.cell.ctr)
> plot(east.ctrs, cex=0.3, xlab="x", ylab="y")
>
> ## Find map lines on this projection, superplot.
> lcc.state.bds <- get.map.lines.M3.proj(file=lcc.file)$coords
> lines(lcc.state.bds, col="darkblue")
>
>
> ## Find the path to a demo file with polar stereographic projection.
> polar.file <- system.file("extdata/surfinfo_polar.ncf", package="M3")
>
> ## Put the cell centers from the subsetted ozone data on this polar
> ## stereographic projection.
> polar.oz <- project.M3.1.to.M3.2(east.ctrs[,1], east.ctrs[,2],
+                                  from.file=lcc.file,
+                                  to.file=polar.file,
+                                  units=lcc.oz$hz.units)
>
> ## Plot the cells centers and boundary lines on the polar
> ## stereographic projection.
> dev.new()
Error in dev.new() : no suitable unused file name for pdf()
Execution halted
|