Supported by Dr. Osamu Ogasawara and  . . |
|
Last data update: 2014.03.03 |
Class "MassSpectrum"Description
Objects from the Class
ExtendsClass Methods
Author(s)Sebastian Gibb mail@sebastiangibb.de See Also
Website: http://strimmerlab.org/software/maldiquant/ Examples
## load package
library("MALDIquant")
## create a MassSpectrum object by default constructor
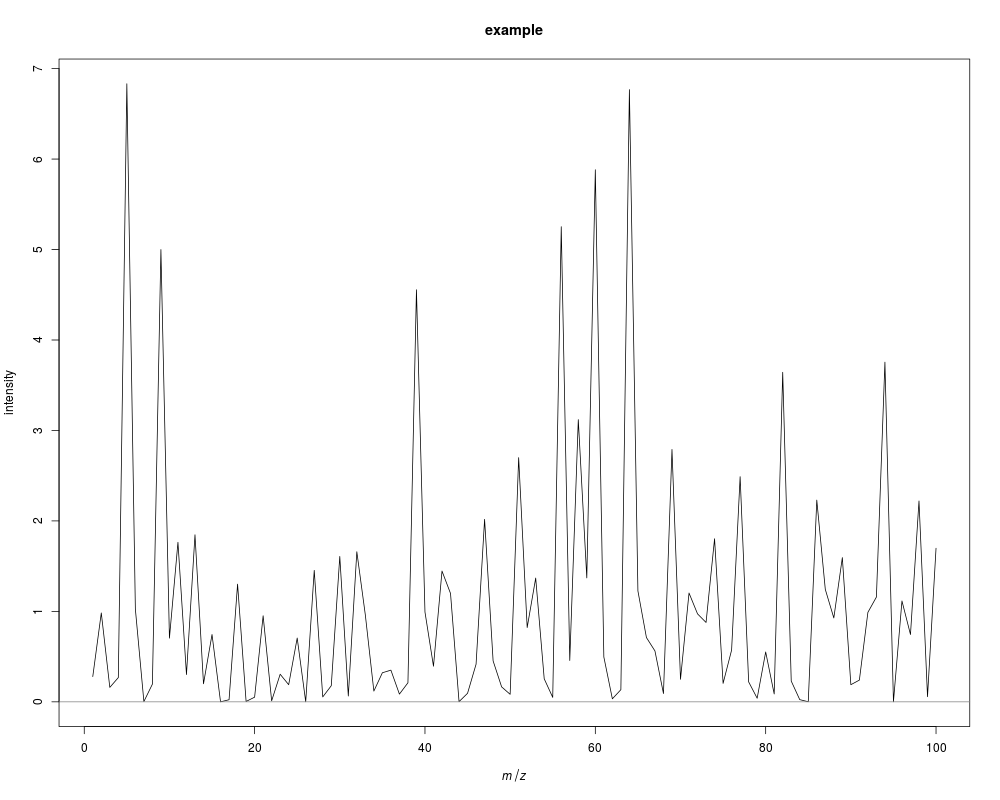
s <- createMassSpectrum(mass=1:100, intensity=rnorm(100)^2,
metaData=list(name="example"))
## show some details
s
## plot spectrum
plot(s)
## get TIC
totalIonCurrent(s)
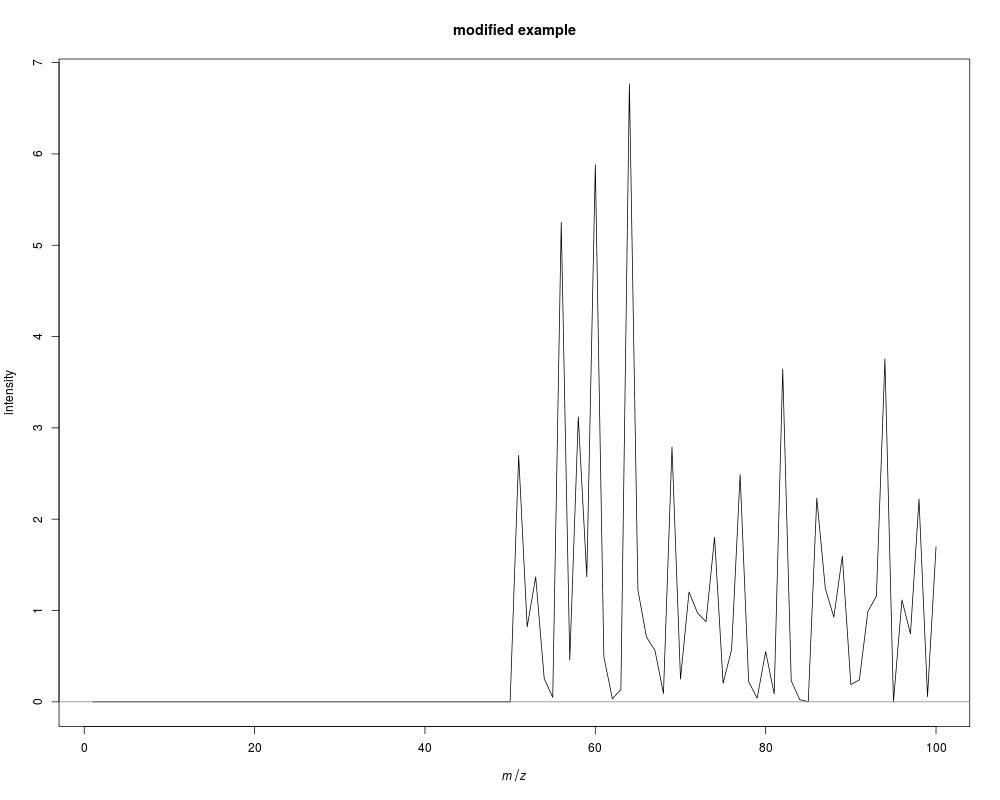
## modify intensity and metaData
intensity(s)[1:50] <- 0
metaData(s) <- list(name="modified example")
## plot again
plot(s)
Results
R version 3.3.1 (2016-06-21) -- "Bug in Your Hair"
Copyright (C) 2016 The R Foundation for Statistical Computing
Platform: x86_64-pc-linux-gnu (64-bit)

R is free software and comes with ABSOLUTELY NO WARRANTY.
You are welcome to redistribute it under certain conditions.
Type 'license()' or 'licence()' for distribution details.

R is a collaborative project with many contributors.
Type 'contributors()' for more information and
'citation()' on how to cite R or R packages in publications.

Type 'demo()' for some demos, 'help()' for on-line help, or
'help.start()' for an HTML browser interface to help.
Type 'q()' to quit R.

> library(MALDIquant)

This is MALDIquant version 1.15
Quantitative Analysis of Mass Spectrometry Data
 See '?MALDIquant' for more information about this package.

> png(filename="/home/ddbj/snapshot/RGM3/R_CC/result/MALDIquant/MassSpectrum-class.Rd_%03d_medium.png", width=480, height=480)
> ### Name: MassSpectrum-class
> ### Title: Class "MassSpectrum"
> ### Aliases: MassSpectrum MassSpectrum-class isRegular
> ###   isRegular,MassSpectrum-method totalIonCurrent
> ###   totalIonCurrent,MassSpectrum-method
> ### Keywords: classes
>
> ### ** Examples
>
> ## load package
> library("MALDIquant")
>
> ## create a MassSpectrum object by default constructor
> s <- createMassSpectrum(mass=1:100, intensity=rnorm(100)^2,
+                         metaData=list(name="example"))
>
> ## show some details
> s
S4 class type            : MassSpectrum
Number of m/z values     : 100
Range of m/z values      : 1 - 100
Range of intensity values: 5.422e-05 - 9.177e+00
Memory usage             : 2.398 KiB
Name                     : example
>
> ## plot spectrum
> plot(s)
>
> ## get TIC
> totalIonCurrent(s)
[1] 115.2347
>
> ## modify intensity and metaData
> intensity(s)[1:50] <- 0
> metaData(s) <- list(name="modified example")
>
> ## plot again
> plot(s)
>
>
>
>
>
> dev.off()
null device
          1
>
|