Supported by Dr. Osamu Ogasawara and  . . |
|
Last data update: 2014.03.03 |
Draws peak labels to plot.Description
Usage
## S4 method for signature 'MassPeaks'
labelPeaks(object,
  index,
  mass,
  labels,
  digits=3, underline=TRUE,
  verticalOffset=abs(diff(par("usr")[3:4]))*0.01,
  absoluteVerticalPos,
  adj=c(0.5, 0), cex=0.7, srt=0,
  avoidOverlap=FALSE,
  arrowLength=0, arrowLwd=0.5, arrowCol=1,
  ...)
Arguments
DetailsPlease note that Author(s)Sebastian Gibb See Also
Website: http://strimmerlab.org/software/maldiquant/ Examples
## load package
library("MALDIquant")
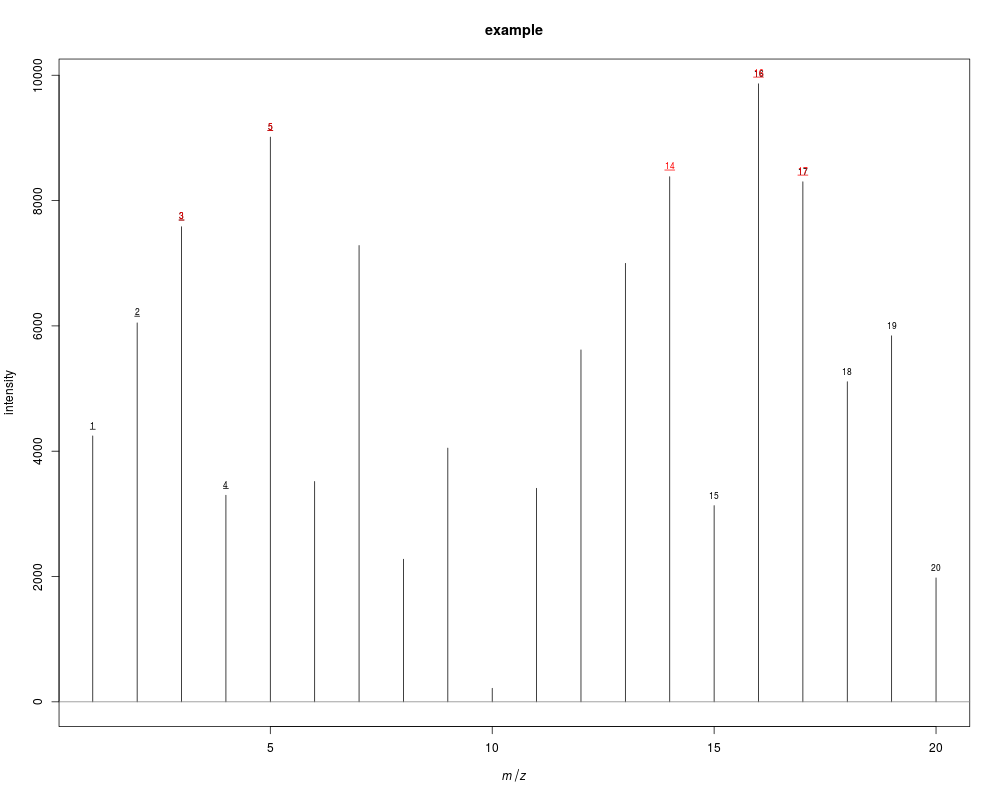
## create a MassPeaks object from scratch
p <- createMassPeaks(mass=1:20, intensity=sample(x=100:10000, size=20),
metaData=list(name="example"))
## plot peaks
plot(p)
## label the first 5 peaks
labelPeaks(p, index=1:5)
## label all peaks in mass range 15 to 20
labelPeaks(p, mass=15:20, underline=FALSE)
## label highest peaks (top 5)
top5 <- intensity(p) %in% sort(intensity(p), decreasing=TRUE)[1:5]
labelPeaks(p, index=top5, col="red")
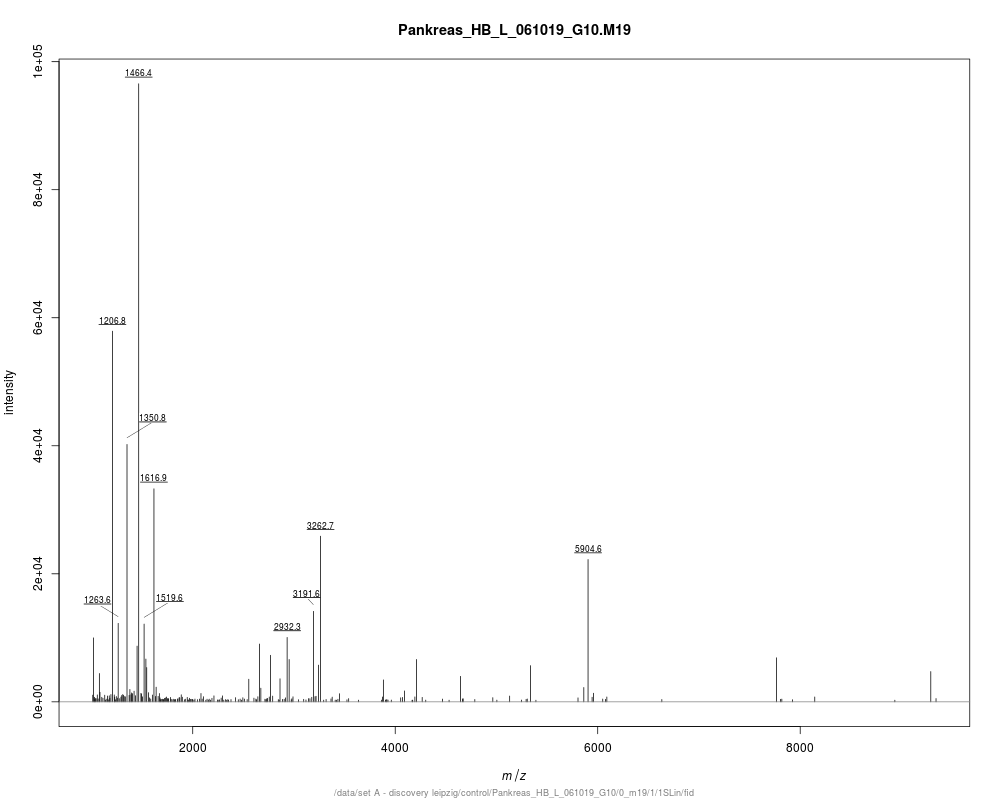
## real example
data("fiedler2009subset")
## a simplified preprocessing
r <- removeBaseline(fiedler2009subset[[1]])
p <- detectPeaks(r)
plot(p)
## label highest peaks (top 10) and avoid label overlap
top10 <- sort(intensity(p), decreasing=TRUE, index.return=TRUE)$ix[1:10]
labelPeaks(p, index=top10, avoidOverlap=TRUE, digits=1)
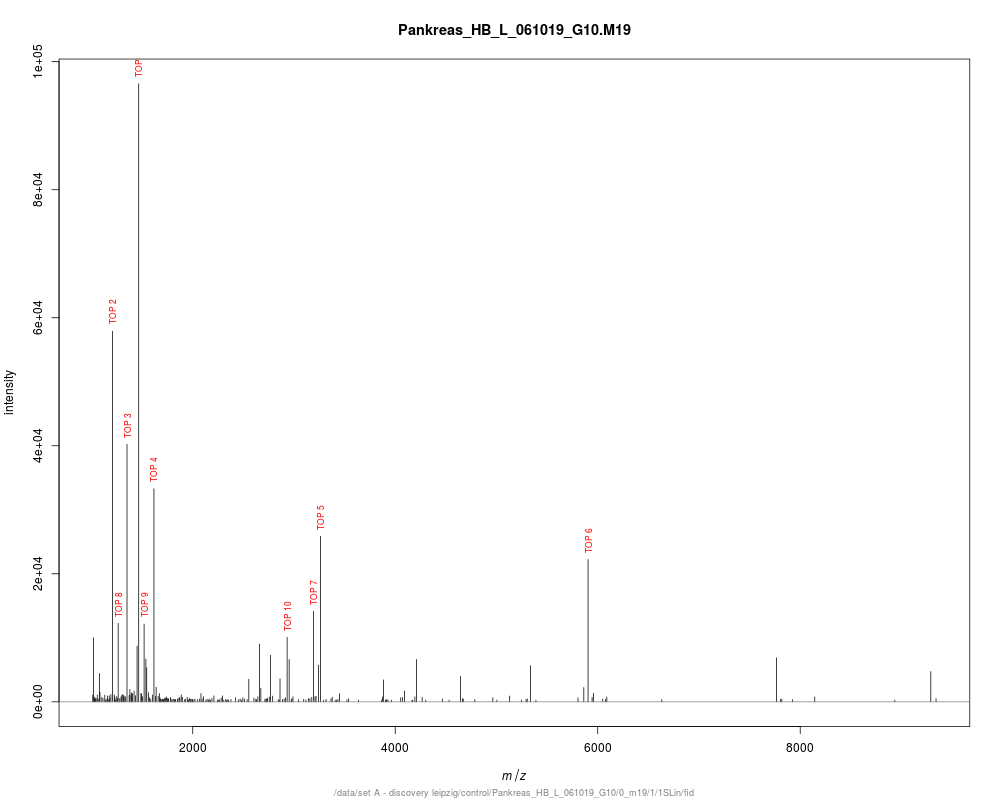
## use own labels and rotate by 90 degree
plot(p)
labelPeaks(p, index=top10, labels=paste("TOP", 1:10), underline=FALSE,
srt=90, adj=c(0, 0.5), col=2)
Results
R version 3.3.1 (2016-06-21) -- "Bug in Your Hair"
Copyright (C) 2016 The R Foundation for Statistical Computing
Platform: x86_64-pc-linux-gnu (64-bit)

R is free software and comes with ABSOLUTELY NO WARRANTY.
You are welcome to redistribute it under certain conditions.
Type 'license()' or 'licence()' for distribution details.

R is a collaborative project with many contributors.
Type 'contributors()' for more information and
'citation()' on how to cite R or R packages in publications.

Type 'demo()' for some demos, 'help()' for on-line help, or
'help.start()' for an HTML browser interface to help.
Type 'q()' to quit R.

> library(MALDIquant)

This is MALDIquant version 1.15
Quantitative Analysis of Mass Spectrometry Data
 See '?MALDIquant' for more information about this package.

> png(filename="/home/ddbj/snapshot/RGM3/R_CC/result/MALDIquant/labelPeaks-methods.Rd_%03d_medium.png", width=480, height=480)
> ### Name: labelPeaks-methods
> ### Title: Draws peak labels to plot.
> ### Aliases: labelPeaks labelPeaks,MassPeaks-method
> ### Keywords: methods Graphics|hplot
>
> ### ** Examples
>
> ## load package
> library("MALDIquant")
>
> ## create a MassPeaks object from scratch
> p <- createMassPeaks(mass=1:20, intensity=sample(x=100:10000, size=20),
+                      metaData=list(name="example"))
>
> ## plot peaks
> plot(p)
>
> ## label the first 5 peaks
> labelPeaks(p, index=1:5)
>
> ## label all peaks in mass range 15 to 20
> labelPeaks(p, mass=15:20, underline=FALSE)
>
> ## label highest peaks (top 5)
> top5 <- intensity(p) %in% sort(intensity(p), decreasing=TRUE)[1:5]
> labelPeaks(p, index=top5, col="red")
>
>
> ## real example
> data("fiedler2009subset")
>
> ## a simplified preprocessing
> r <- removeBaseline(fiedler2009subset[[1]])
> p <- detectPeaks(r)
> plot(p)
>
> ## label highest peaks (top 10) and avoid label overlap
> top10 <- sort(intensity(p), decreasing=TRUE, index.return=TRUE)$ix[1:10]
> labelPeaks(p, index=top10, avoidOverlap=TRUE, digits=1)
>
> ## use own labels and rotate by 90 degree
> plot(p)
> labelPeaks(p, index=top10, labels=paste("TOP", 1:10), underline=FALSE,
+            srt=90, adj=c(0, 0.5), col=2)
>
>
>
>
>
> dev.off()
null device
          1
>
|