Supported by Dr. Osamu Ogasawara and  . . |
|
Last data update: 2014.03.03 |
Plots an AbstractMassObject object.DescriptionThis is an overloaded method to allow plotting of an
Usage
## S4 method for signature 'AbstractMassObject,missing'
plot(x, col="black",
   xlab=expression(italic(m/z)), ylab="intensity",
   type=ifelse(isMassPeaks(x), "h", "l"),
   xlim=c(ifelse(length(x@mass), min(x@mass, na.rm=TRUE), 0),
      ifelse(length(x@mass), max(x@mass, na.rm=TRUE), 1)),
   ylim=c(0, ifelse(length(x@intensity), max(x@intensity, na.rm=TRUE), 1)),
   main=x@metaData$name, sub=x@metaData$file,
   cex.sub=0.75, col.sub="#808080",
   abline.col="#808080", ...)
Arguments
Author(s)Sebastian Gibb mail@sebastiangibb.de See Also
Website: http://strimmerlab.org/software/maldiquant/ Examples
## load package
library("MALDIquant")
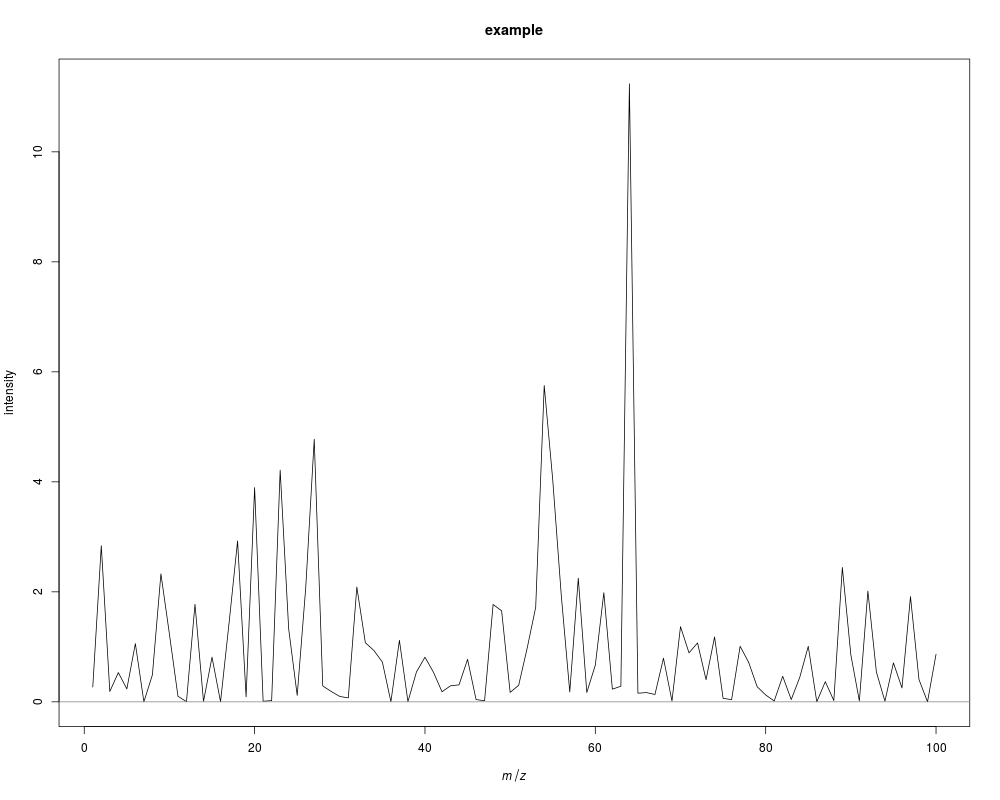
## create a MassSpectrum object by default constructor
s <- createMassSpectrum(mass=1:100, intensity=rnorm(100)^2,
metaData=list(name="example"))
## show some details
s
## plot spectrum
plot(s)
Results
R version 3.3.1 (2016-06-21) -- "Bug in Your Hair"
Copyright (C) 2016 The R Foundation for Statistical Computing
Platform: x86_64-pc-linux-gnu (64-bit)

R is free software and comes with ABSOLUTELY NO WARRANTY.
You are welcome to redistribute it under certain conditions.
Type 'license()' or 'licence()' for distribution details.

R is a collaborative project with many contributors.
Type 'contributors()' for more information and
'citation()' on how to cite R or R packages in publications.

Type 'demo()' for some demos, 'help()' for on-line help, or
'help.start()' for an HTML browser interface to help.
Type 'q()' to quit R.

> library(MALDIquant)

This is MALDIquant version 1.15
Quantitative Analysis of Mass Spectrometry Data
 See '?MALDIquant' for more information about this package.

> png(filename="/home/ddbj/snapshot/RGM3/R_CC/result/MALDIquant/plot-methods.Rd_%03d_medium.png", width=480, height=480)
> ### Name: plot-methods
> ### Title: Plots an AbstractMassObject object.
> ### Aliases: plot,AbstractMassObject,missing-method
> ###   plot,MassSpectrum,missing-method
> ### Keywords: methods Graphics|hplot
>
> ### ** Examples
>
> ## load package
> library("MALDIquant")
>
> ## create a MassSpectrum object by default constructor
> s <- createMassSpectrum(mass=1:100, intensity=rnorm(100)^2,
+                         metaData=list(name="example"))
>
> ## show some details
> s
S4 class type            : MassSpectrum
Number of m/z values     : 100
Range of m/z values      : 1 - 100
Range of intensity values: 6.651e-07 - 9.88e+00
Memory usage             : 2.398 KiB
Name                     : example
>
> ## plot spectrum
> plot(s)
>
>
>
>
>
> dev.off()
null device
          1
>
|
Created & Maintained by Osamu Ogasawara (osamu.ogasawara@gmail.com) and 