R version 3.3.1 (2016-06-21) -- "Bug in Your Hair"
Copyright (C) 2016 The R Foundation for Statistical Computing
Platform: x86_64-pc-linux-gnu (64-bit)
R is free software and comes with ABSOLUTELY NO WARRANTY.
You are welcome to redistribute it under certain conditions.
Type 'license()' or 'licence()' for distribution details.
R is a collaborative project with many contributors.
Type 'contributors()' for more information and
'citation()' on how to cite R or R packages in publications.
Type 'demo()' for some demos, 'help()' for on-line help, or
'help.start()' for an HTML browser interface to help.
Type 'q()' to quit R.
> library(MAMA)
Loading required package: genefilter
Loading required package: metaMA
Attaching package: 'metaMA'
The following object is masked from 'package:genefilter':
rowVars
Loading required package: xtable
Loading required package: multtest
Loading required package: BiocGenerics
Loading required package: parallel
Attaching package: 'BiocGenerics'
The following objects are masked from 'package:parallel':
clusterApply, clusterApplyLB, clusterCall, clusterEvalQ,
clusterExport, clusterMap, parApply, parCapply, parLapply,
parLapplyLB, parRapply, parSapply, parSapplyLB
The following objects are masked from 'package:stats':
IQR, mad, xtabs
The following objects are masked from 'package:base':
Filter, Find, Map, Position, Reduce, anyDuplicated, append,
as.data.frame, cbind, colnames, do.call, duplicated, eval, evalq,
get, grep, grepl, intersect, is.unsorted, lapply, lengths, mapply,
match, mget, order, paste, pmax, pmax.int, pmin, pmin.int, rank,
rbind, rownames, sapply, setdiff, sort, table, tapply, union,
unique, unsplit
Loading required package: Biobase
Welcome to Bioconductor
Vignettes contain introductory material; view with
'browseVignettes()'. To cite Bioconductor, see
'citation("Biobase")', and for packages 'citation("pkgname")'.
Loading required package: gtools
Loading required package: grid
Loading required package: GeneMeta
Attaching package: 'MAMA'
The following objects are masked from 'package:GeneMeta':
multExpFDR, zScoreFDR, zScorePermuted, zScores
> png(filename="/home/ddbj/snapshot/RGM3/R_CC/result/MAMA/metaheat.Rd_%03d_medium.png", width=480, height=480)
> ### Name: metaheat
> ### Title: Display Data as Heatmap
> ### Aliases: metaheat
> ### Keywords: hplot
>
> ### ** Examples
>
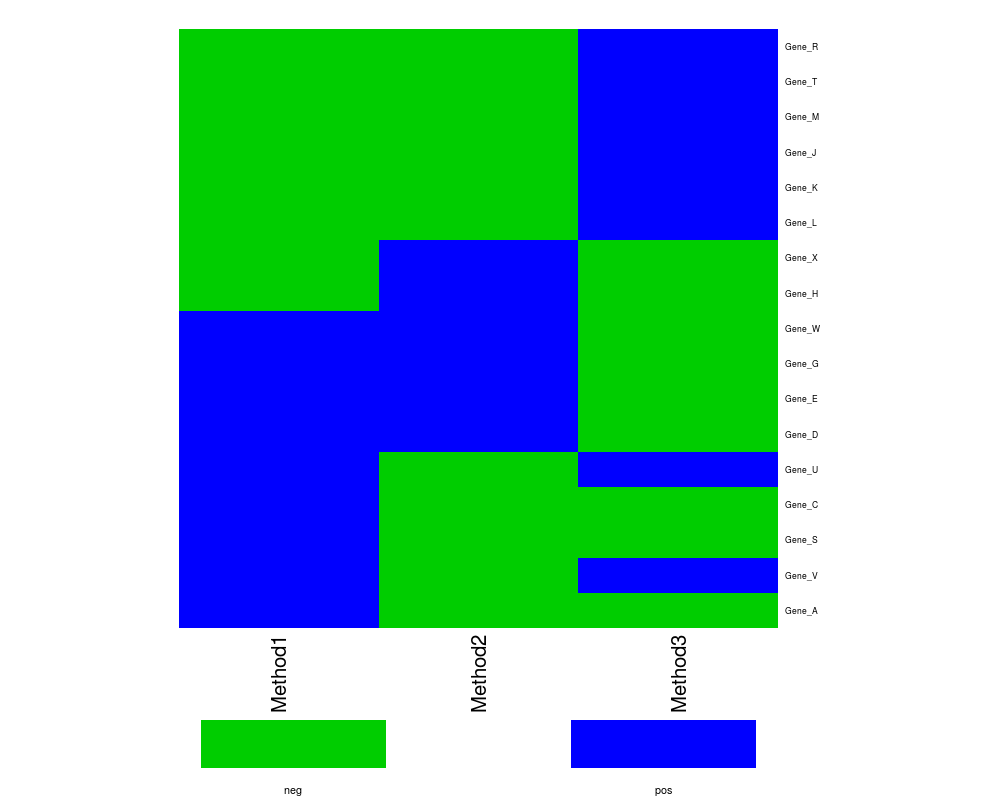
> lists<-list(Method1=c("Gene_A", "Gene_V","Gene_S","Gene_C","Gene_U","Gene_D","Gene_E","Gene_G","Gene_W"),
+ Method2=c("Gene_D","Gene_W","Gene_G","Gene_E","Gene_H","Gene_X"),
+ Method3=c("Gene_L","Gene_K","Gene_J","Gene_M","Gene_V","Gene_T","Gene_R","Gene_U"))
> A<-make.matrix(lists)
> metaheat(A, legend=1, col=c(3,4))
>
>
>
>
>
> dev.off()
null device
1
>
 .
.