Combination operator. One of "mean" or "median". Default is "mean".
output
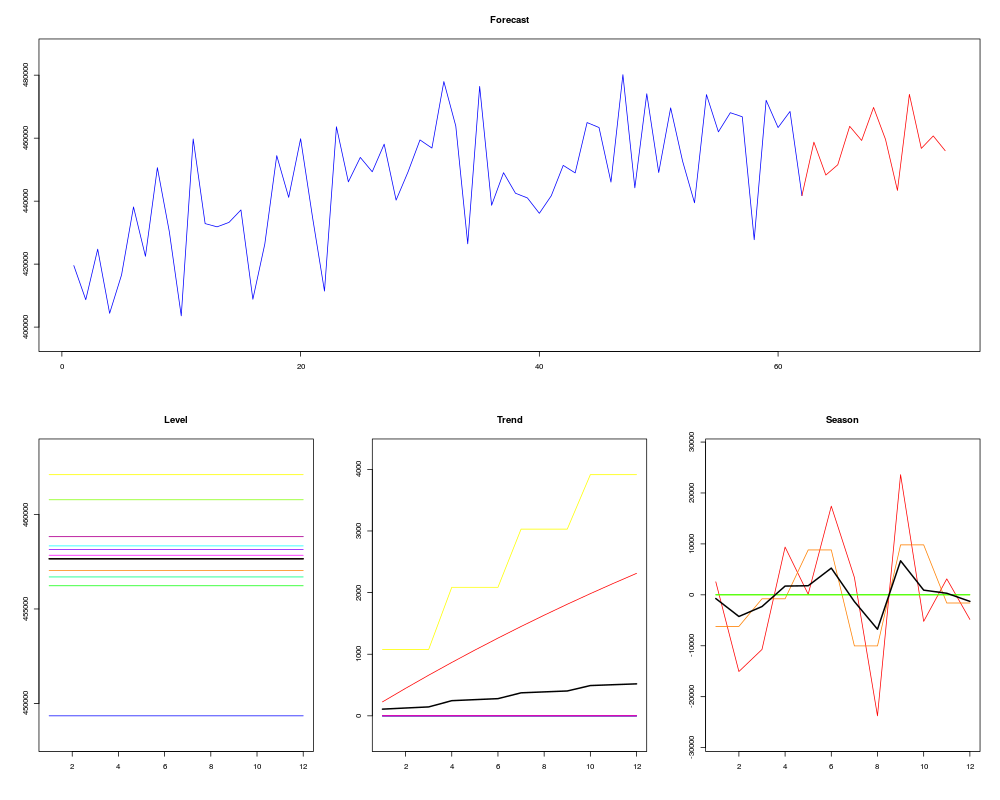
Type of output. One of "forecast" or "all". Default is "forecast". If output="all",
both forecasts and components estimates per aggregation level are provided. For the components the rainbow colouring scheme is used. Red is aggregation level 1, followed by yellow, green, cyan, blue and magenta for the higher aggregation levels.
outplot
Provide output plot. 0 = no; 1 = time series and forecast only; 2 = time series,
forecasts and components. Default is 1.
hybrid
Provide hybrid forecasts, as in Kourentzes et al. paper. If minimumAL > 1 then the minimumAL ETS forecasts are used. Default is TRUE.
Value
forecasts
Vector with forecasts.
components
Array with MAPA components, if output="all".
Author(s)
Nikolaos Kourentzes and Fotios Petropoulos
References
Kourentzes N., Petropoulos F., Trapero J.R., 2014. Improving forecasting by estimating time
series structural components across multiple frequencies, International Journal of Forecasting,
30(2), 291-302.
R version 3.3.1 (2016-06-21) -- "Bug in Your Hair"
Copyright (C) 2016 The R Foundation for Statistical Computing
Platform: x86_64-pc-linux-gnu (64-bit)

R is free software and comes with ABSOLUTELY NO WARRANTY.
You are welcome to redistribute it under certain conditions.
Type 'license()' or 'licence()' for distribution details.

R is a collaborative project with many contributors.
Type 'contributors()' for more information and
'citation()' on how to cite R or R packages in publications.

Type 'demo()' for some demos, 'help()' for on-line help, or
'help.start()' for an HTML browser interface to help.
Type 'q()' to quit R.

> library(MAPA)
Loading required package: forecast
Loading required package: zoo

Attaching package: 'zoo'

The following objects are masked from 'package:base':

    as.Date, as.Date.numeric

Loading required package: timeDate
This is forecast 7.1

Loading required package: parallel
> png(filename="/home/ddbj/snapshot/RGM3/R_CC/result/MAPA/mapacalc.Rd_%03d_medium.png", width=480, height=480)
> ### Name: mapacalc
> ### Title: MAPA Internal Calculation of Forecasts
> ### Aliases: mapacalc
> ### Keywords: ~mapafor
>
> ### ** Examples
>
> mapafit <- mapaest(admissions,outplot=0)
> mapacalc(admissions,mapafit,outplot=2)
     t+1      t+2      t+3      t+4      t+5      t+6      t+7      t+8
458736.0 448286.6 451543.8 463762.2 459267.6 469755.6 459617.0 443405.9
     t+9     t+10     t+11     t+12
473904.8 456747.4 460704.2 456014.0
>
>
>
>
>
> dev.off()
null device
          1
>
 .
.