Periods in a season of the time series at the sampled frequency.
If insample is a ts object then this is taken from its frequency, unless overriden.
minimumAL
Lowest aggregation level to use. Default = 1, maximumAL>1.
maximumAL
Highest aggregation level to use. Default = ppy.
paral
Use parallel processing. 0 = no; 1 = yes (requires initialised cluster); 2 = yes
and initialise cluster. Default is 0.
display
Display calculation progress in console. 0 = no; 1 = yes. Default is 0.
outplot
Provide output plot. 0 = no; 1 = yes. Default is 1.
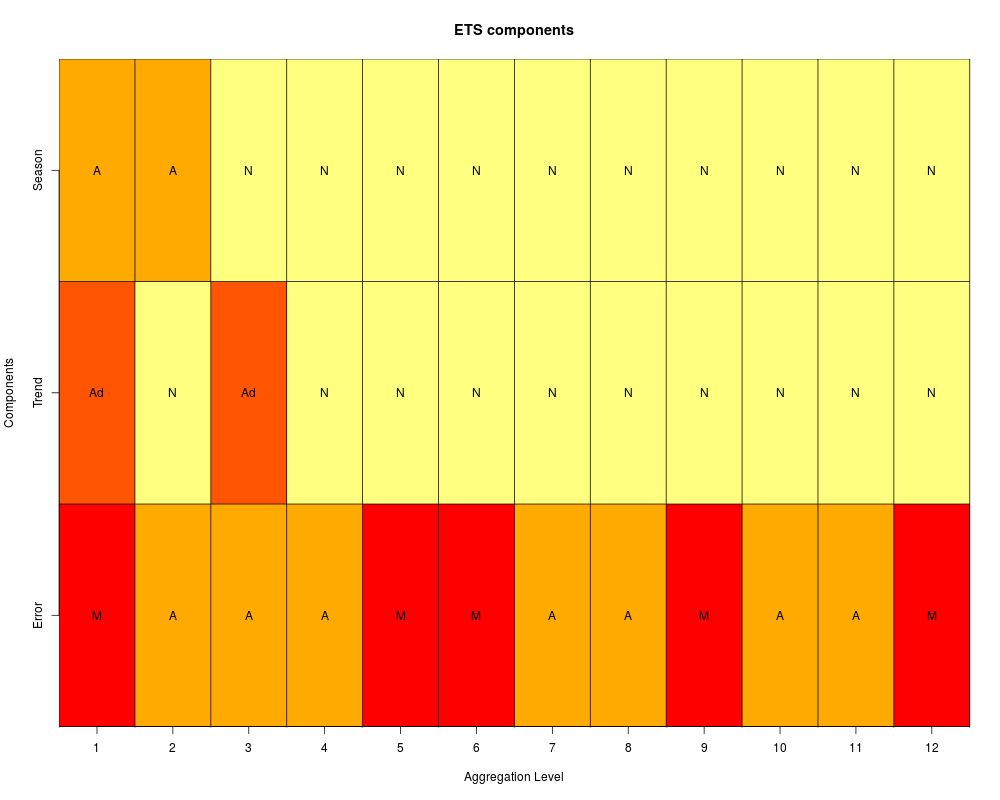
model
Allow only that type of ETS at each aggregation level. This follows similar coding to the ets function. The first letter refers to the error type ("A", "M" or "Z"); the second letter refers to the trend type ("N","A","Ad","M","Md" or "Z"); and the third letter refers to the season type ("N","A","M" or "Z"). The letters mean: "N"=none, "A"=additive, "M"=multiplicative and "Z"=automatically selected. A "d" for trend implies damped. By default model="ZZZ". If due to sample limitation ETS cannot be calculated at an aggregation level for the selected model, then no estimation is done for that specific level. For aggregation levels that seasonality becomes 1 then a non-seasonal model is estimated.
Value
mapafit
Estimated MAPA model structure.
Author(s)
Nikolaos Kourentzes and Fotios Petropoulos
References
Kourentzes N., Petropoulos F., Trapero J.R., 2014. Improving forecasting by estimating time
series structural components across multiple frequencies, International Journal of Forecasting,
30(2), 291-302.
See Also
mapa, mapafor.
Examples
mapafit <- mapaest(admissions)
Results
R version 3.3.1 (2016-06-21) -- "Bug in Your Hair"
Copyright (C) 2016 The R Foundation for Statistical Computing
Platform: x86_64-pc-linux-gnu (64-bit)

R is free software and comes with ABSOLUTELY NO WARRANTY.
You are welcome to redistribute it under certain conditions.
Type 'license()' or 'licence()' for distribution details.

R is a collaborative project with many contributors.
Type 'contributors()' for more information and
'citation()' on how to cite R or R packages in publications.

Type 'demo()' for some demos, 'help()' for on-line help, or
'help.start()' for an HTML browser interface to help.
Type 'q()' to quit R.

> library(MAPA)
Loading required package: forecast
Loading required package: zoo

Attaching package: 'zoo'

The following objects are masked from 'package:base':

    as.Date, as.Date.numeric

Loading required package: timeDate
This is forecast 7.1

Loading required package: parallel
> png(filename="/home/ddbj/snapshot/RGM3/R_CC/result/MAPA/mapaest.Rd_%03d_medium.png", width=480, height=480)
> ### Name: mapaest
> ### Title: MAPA Estimation
> ### Aliases: mapaest
> ### Keywords: ~mapa ~mapafor
>
> ### ** Examples
>
> mapafit <- mapaest(admissions)
>
>
>
>
>
> dev.off()
null device
          1
>
 .
.