Vector containing desirable aggregation levels. Must be positive and integer. If larger than length(y) then it is ignored.
fmean
If TRUE the aggregated is done using mean, otherwise sum is used.
outplot
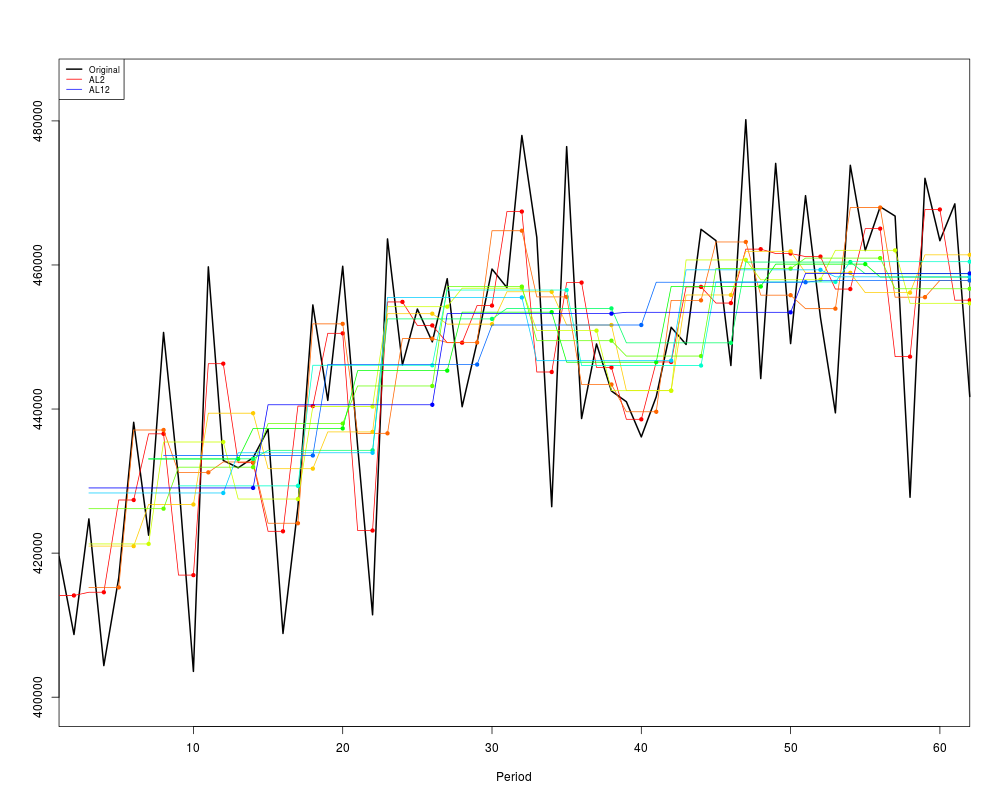
If TRUE a plot of the original series and the aggregated ones is produced.
Value
out
List of temporally aggregated series. If y was a ts object, then 'out' has ts objects with appropriate frequencies. Any non-integer frequency is set equal to 1. Series are named ALx, where x is the aggregation level.
all
An array containing all aggregated series in the original frequency. Series are named ALx, where x is the aggregation level.
idx
List of indices used to produce 'out' from 'all': y.out[[i]] <- y.all[y.idx[[i]],i]. Series are named ALx, where x is the aggregation level.
Author(s)
Nikolaos Kourentzes
Examples
out <- tsaggr(admissions,fout=2:12,fmean=TRUE,outplot=TRUE)
Results
R version 3.3.1 (2016-06-21) -- "Bug in Your Hair"
Copyright (C) 2016 The R Foundation for Statistical Computing
Platform: x86_64-pc-linux-gnu (64-bit)

R is free software and comes with ABSOLUTELY NO WARRANTY.
You are welcome to redistribute it under certain conditions.
Type 'license()' or 'licence()' for distribution details.

R is a collaborative project with many contributors.
Type 'contributors()' for more information and
'citation()' on how to cite R or R packages in publications.

Type 'demo()' for some demos, 'help()' for on-line help, or
'help.start()' for an HTML browser interface to help.
Type 'q()' to quit R.

> library(MAPA)
Loading required package: forecast
Loading required package: zoo

Attaching package: 'zoo'

The following objects are masked from 'package:base':

    as.Date, as.Date.numeric

Loading required package: timeDate
This is forecast 7.1

Loading required package: parallel
> png(filename="/home/ddbj/snapshot/RGM3/R_CC/result/MAPA/tsaggr.Rd_%03d_medium.png", width=480, height=480)
> ### Name: tsaggr
> ### Title: Non-overlapping temporal aggregation
> ### Aliases: tsaggr
> ### Keywords: ~tsaggr
>
> ### ** Examples
>
> out <- tsaggr(admissions,fout=2:12,fmean=TRUE,outplot=TRUE)
>
>
>
>
>
> dev.off()
null device
          1
>
 .
.