Supported by Dr. Osamu Ogasawara and  . . |
|
Last data update: 2014.03.03 |
Plot Extinction Risk MetricsDescriptionGenerates a six-panel plot of extinction risk metrics used in Population Viability Analysis (PVA). This is a function used by one of the vignettes in the UsageCSEGriskfigure(data, te = 100, absolutethresh = FALSE, threshold = 0.1, datalogged = FALSE, silent = FALSE, return.model = FALSE, CI.method = "hessian", CI.sim = 1000) Arguments
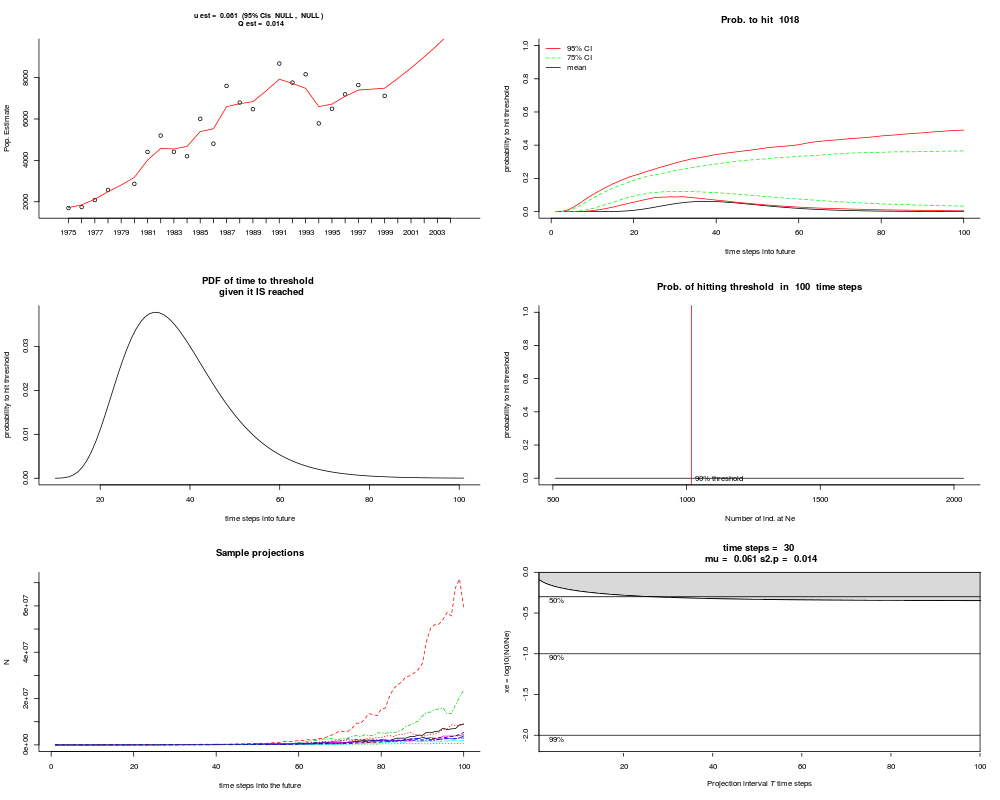
DetailsPanel 1: Time-series plot of the data. Panel 2: CDF of extinction risk. Panel 3: PDF of time to reach threshold. Panel 4: Probability of reaching different thresholds during forecast period. Panel 5: Sample projections. Panel 6: TMU plot (uncertainty as a function of the forecast). ValueIf Author(s)Eli Holmes, NOAA, Seattle, USA. eli(dot)holmes(at)noaa(dot)gov ReferencesHolmes, E. E., E. J. Ward, and M. D. Scheuerell (2012) Analysis of multivariate time-series using the MARSS package. NOAA Fisheries, Northwest Fisheries Science
Center, 2725 Montlake Blvd E., Seattle, WA 98112 Type (theory behind the figure) Holmes, E. E., J. L. Sabo, S. V. Viscido, and W. F. Fagan. (2007) A statistical approach to quasi-extinction forecasting. Ecology Letters 10:1182-1198. (CDF and PDF calculations) Dennis, B., P. L. Munholland, and J. M. Scott. (1991) Estimation of growth and extinction parameters for endangered species. Ecological Monographs 61:115-143. (TMU figure) Ellner, S. P. and E. E. Holmes. (2008) Resolving the debate on when extinction risk is predictable. Ecology Letters 11:E1-E5. See Also
Examplesd = harborSeal[,1:2] kem = CSEGriskfigure(d, datalogged = TRUE) Results
R version 3.3.1 (2016-06-21) -- "Bug in Your Hair"
Copyright (C) 2016 The R Foundation for Statistical Computing
Platform: x86_64-pc-linux-gnu (64-bit)

R is free software and comes with ABSOLUTELY NO WARRANTY.
You are welcome to redistribute it under certain conditions.
Type 'license()' or 'licence()' for distribution details.

R is a collaborative project with many contributors.
Type 'contributors()' for more information and
'citation()' on how to cite R or R packages in publications.

Type 'demo()' for some demos, 'help()' for on-line help, or
'help.start()' for an HTML browser interface to help.
Type 'q()' to quit R.

> library(MARSS)
> png(filename="/home/ddbj/snapshot/RGM3/R_CC/result/MARSS/CSEGriskfigure.Rd_%03d_medium.png", width=480, height=480)
> ### Name: CSEGriskfigure
> ### Title: Plot Extinction Risk Metrics
> ### Aliases: CSEGriskfigure
> ### Keywords: hplot
>
> ### ** Examples
>
> d = harborSeal[,1:2]
> kem = CSEGriskfigure(d,  datalogged = TRUE)
Analysis assumes that data and threshold are already logged
Using an percentage threshold for the extinction threshold
Threshold is 90 percent decline
>
>
>
>
>
> dev.off()
null device
          1
>
|