Supported by Dr. Osamu Ogasawara and  . . |
|
Last data update: 2014.03.03 |
Box-Cox Transformations for Linear ModelsDescriptionComputes and optionally plots profile log-likelihoods for the parameter of the Box-Cox power transformation. Usage
boxcox(object, ...)

## Default S3 method:
boxcox(object, lambda = seq(-2, 2, 1/10), plotit = TRUE,
       interp, eps = 1/50, xlab = expression(lambda),
       ylab = "log-Likelihood", ...)

## S3 method for class 'formula'
boxcox(object, lambda = seq(-2, 2, 1/10), plotit = TRUE,
       interp, eps = 1/50, xlab = expression(lambda),
       ylab = "log-Likelihood", ...)

## S3 method for class 'lm'
boxcox(object, lambda = seq(-2, 2, 1/10), plotit = TRUE,
       interp, eps = 1/50, xlab = expression(lambda),
       ylab = "log-Likelihood", ...)
Arguments
ValueA list of the Side EffectsIf ReferencesBox, G. E. P. and Cox, D. R. (1964) An analysis of transformations (with discussion). Journal of the Royal Statistical Society B, 26, 211–252. Venables, W. N. and Ripley, B. D. (2002) Modern Applied Statistics with S. Fourth edition. Springer. Examples
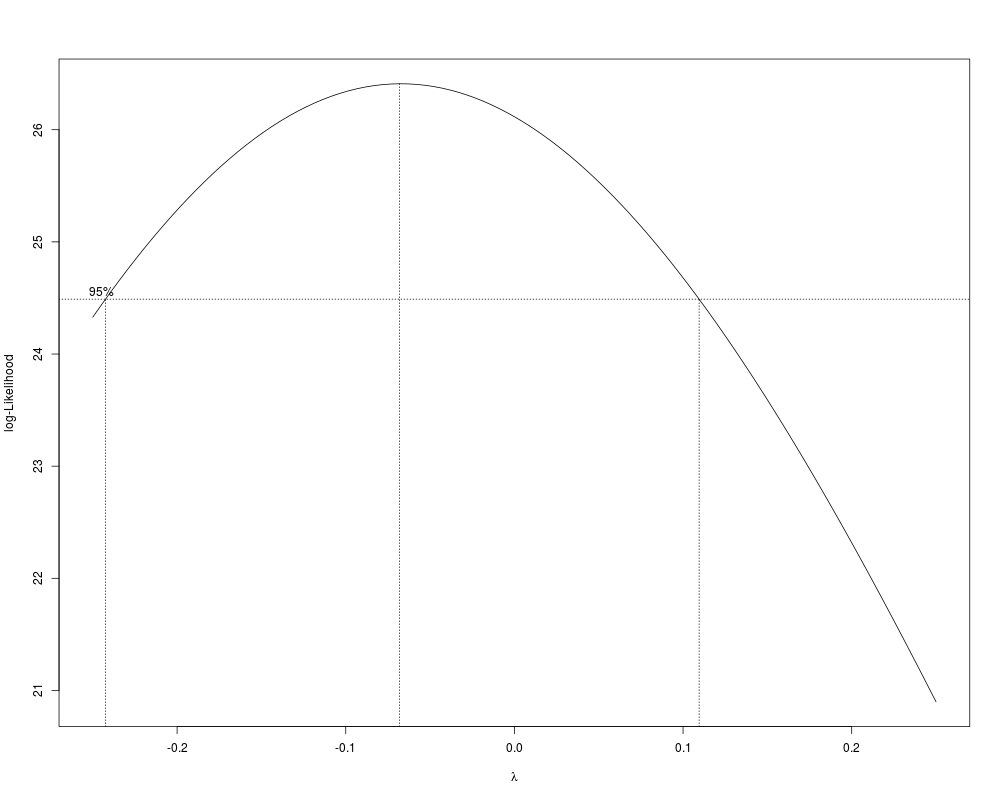
boxcox(Volume ~ log(Height) + log(Girth), data = trees,
lambda = seq(-0.25, 0.25, length = 10))
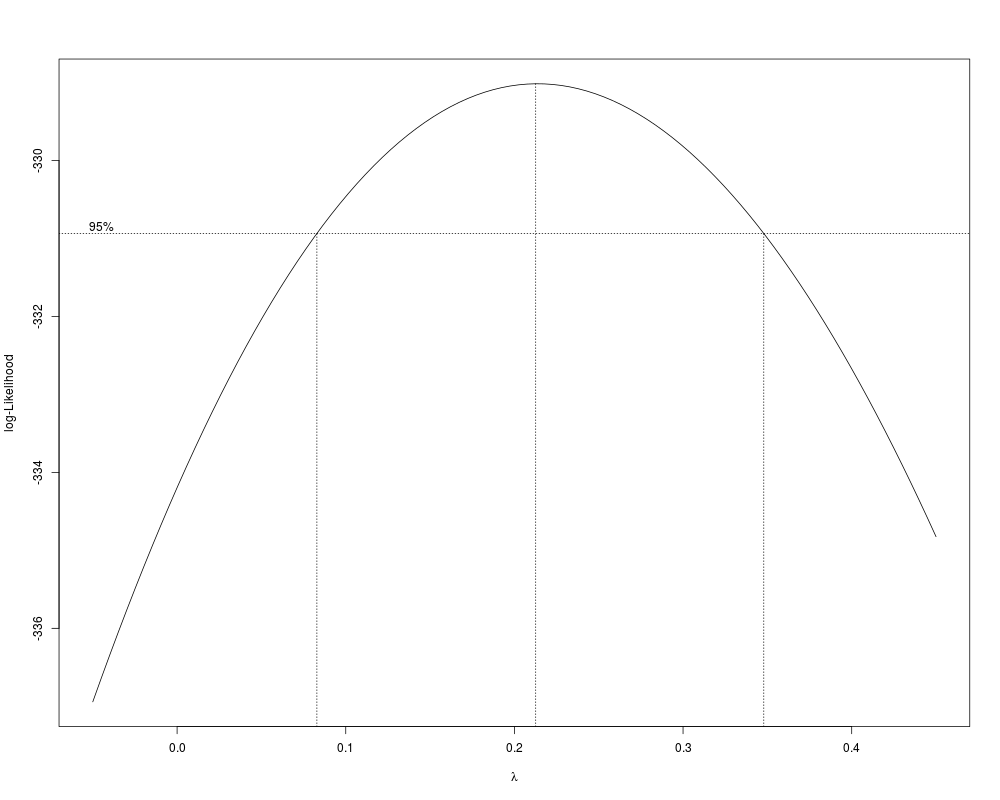
boxcox(Days+1 ~ Eth*Sex*Age*Lrn, data = quine,
lambda = seq(-0.05, 0.45, len = 20))
Results
R version 3.3.1 (2016-06-21) -- "Bug in Your Hair"
Copyright (C) 2016 The R Foundation for Statistical Computing
Platform: x86_64-pc-linux-gnu (64-bit)

R is free software and comes with ABSOLUTELY NO WARRANTY.
You are welcome to redistribute it under certain conditions.
Type 'license()' or 'licence()' for distribution details.

R is a collaborative project with many contributors.
Type 'contributors()' for more information and
'citation()' on how to cite R or R packages in publications.

Type 'demo()' for some demos, 'help()' for on-line help, or
'help.start()' for an HTML browser interface to help.
Type 'q()' to quit R.

> library(MASS)
> png(filename="/home/ddbj/snapshot/RGM3/R_CC/result/MASS/boxcox.Rd_%03d_medium.png", width=480, height=480)
> ### Name: boxcox
> ### Title: Box-Cox Transformations for Linear Models
> ### Aliases: boxcox boxcox.default boxcox.formula boxcox.lm
> ### Keywords: regression models hplot
>
> ### ** Examples
>
> boxcox(Volume ~ log(Height) + log(Girth), data = trees,
+        lambda = seq(-0.25, 0.25, length = 10))
>
> boxcox(Days+1 ~ Eth*Sex*Age*Lrn, data = quine,
+        lambda = seq(-0.05, 0.45, len = 20))
>
>
>
>
>
> dev.off()
null device
          1
>
|