Supported by Dr. Osamu Ogasawara and  . . |
|
Last data update: 2014.03.03 |
Data from an Oats Field TrialDescriptionThe yield of oats from a split-plot field trial using three varieties and four levels of manurial treatment. The experiment was laid out in 6 blocks of 3 main plots, each split into 4 sub-plots. The varieties were applied to the main plots and the manurial treatments to the sub-plots. Usageoats FormatThis data frame contains the following columns:
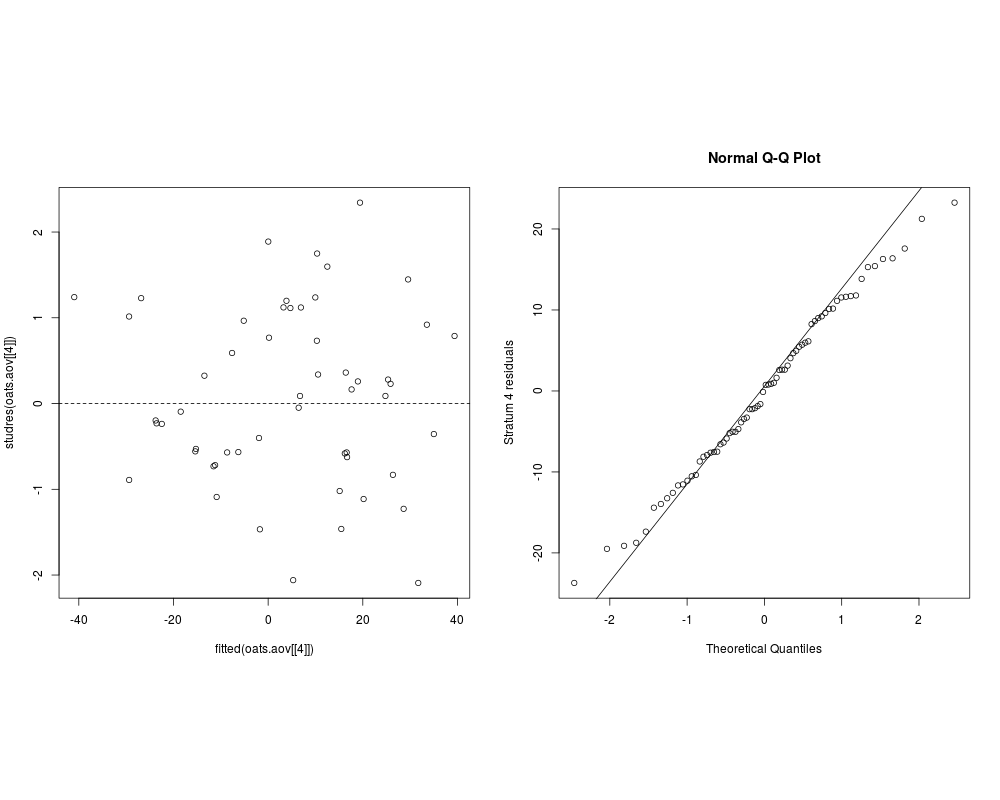
SourceYates, F. (1935) Complex experiments, Journal of the Royal Statistical Society Suppl. 2, 181–247. Also given in Yates, F. (1970) Experimental design: Selected papers of Frank Yates, C.B.E, F.R.S. London: Griffin. ReferencesVenables, W. N. and Ripley, B. D. (2002) Modern Applied Statistics with S. Fourth edition. Springer. Examplesoats$Nf <- ordered(oats$N, levels = sort(levels(oats$N))) oats.aov <- aov(Y ~ Nf*V + Error(B/V), data = oats, qr = TRUE) summary(oats.aov) summary(oats.aov, split = list(Nf=list(L=1, Dev=2:3))) par(mfrow = c(1,2), pty = "s") plot(fitted(oats.aov[[4]]), studres(oats.aov[[4]])) abline(h = 0, lty = 2) oats.pr <- proj(oats.aov) qqnorm(oats.pr[[4]][,"Residuals"], ylab = "Stratum 4 residuals") qqline(oats.pr[[4]][,"Residuals"]) par(mfrow = c(1,1), pty = "m") oats.aov2 <- aov(Y ~ N + V + Error(B/V), data = oats, qr = TRUE) model.tables(oats.aov2, type = "means", se = TRUE) Results
R version 3.3.1 (2016-06-21) -- "Bug in Your Hair"
Copyright (C) 2016 The R Foundation for Statistical Computing
Platform: x86_64-pc-linux-gnu (64-bit)

R is free software and comes with ABSOLUTELY NO WARRANTY.
You are welcome to redistribute it under certain conditions.
Type 'license()' or 'licence()' for distribution details.

R is a collaborative project with many contributors.
Type 'contributors()' for more information and
'citation()' on how to cite R or R packages in publications.

Type 'demo()' for some demos, 'help()' for on-line help, or
'help.start()' for an HTML browser interface to help.
Type 'q()' to quit R.

> library(MASS)
> png(filename="/home/ddbj/snapshot/RGM3/R_CC/result/MASS/oats.Rd_%03d_medium.png", width=480, height=480)
> ### Name: oats
> ### Title: Data from an Oats Field Trial
> ### Aliases: oats
> ### Keywords: datasets
>
> ### ** Examples
>
> oats$Nf <- ordered(oats$N, levels = sort(levels(oats$N)))
> oats.aov <- aov(Y ~ Nf*V + Error(B/V), data = oats, qr = TRUE)
> summary(oats.aov)

Error: B
          Df Sum Sq Mean Sq F value Pr(>F)
Residuals  5  15875    3175

Error: B:V
          Df Sum Sq Mean Sq F value Pr(>F)
V          2   1786   893.2   1.485  0.272
Residuals 10   6013   601.3

Error: Within
          Df Sum Sq Mean Sq F value   Pr(>F)
Nf         3  20020    6673  37.686 2.46e-12 ***
Nf:V       6    322      54   0.303    0.932
Residuals 45   7969     177
---
Signif. codes:  0 '***' 0.001 '**' 0.01 '*' 0.05 '.' 0.1 ' ' 1
> summary(oats.aov, split = list(Nf=list(L=1, Dev=2:3)))

Error: B
          Df Sum Sq Mean Sq F value Pr(>F)
Residuals  5  15875    3175

Error: B:V
          Df Sum Sq Mean Sq F value Pr(>F)
V          2   1786   893.2   1.485  0.272
Residuals 10   6013   601.3

Error: Within
            Df Sum Sq Mean Sq F value   Pr(>F)
Nf           3  20020    6673  37.686 2.46e-12 ***
  Nf: L      1  19536   19536 110.323 1.09e-13 ***
  Nf: Dev    2    484     242   1.367    0.265
Nf:V         6    322      54   0.303    0.932
  Nf:V: L    2    168      84   0.475    0.625
  Nf:V: Dev  4    153      38   0.217    0.928
Residuals   45   7969     177
---
Signif. codes:  0 '***' 0.001 '**' 0.01 '*' 0.05 '.' 0.1 ' ' 1
> par(mfrow = c(1,2), pty = "s")
> plot(fitted(oats.aov[[4]]), studres(oats.aov[[4]]))
> abline(h = 0, lty = 2)
> oats.pr <- proj(oats.aov)
> qqnorm(oats.pr[[4]][,"Residuals"], ylab = "Stratum 4 residuals")
> qqline(oats.pr[[4]][,"Residuals"])
>
> par(mfrow = c(1,1), pty = "m")
> oats.aov2 <- aov(Y ~ N + V + Error(B/V), data = oats, qr = TRUE)
> model.tables(oats.aov2, type = "means", se = TRUE)
Tables of means
Grand mean

103.9722

 N
N
0.0cwt 0.2cwt 0.4cwt 0.6cwt
 79.39  98.89 114.22 123.39

 V
V
Golden.rain  Marvellous     Victory
     104.50      109.79       97.63
Warning message:
In model.tables.aovlist(oats.aov2, type = "means", se = TRUE) :
  SEs for type 'means' are not yet implemented
>
>
>
>
>
> dev.off()
null device
          1
>
|