Supported by Dr. Osamu Ogasawara and  . . |
|
Last data update: 2014.03.03 |
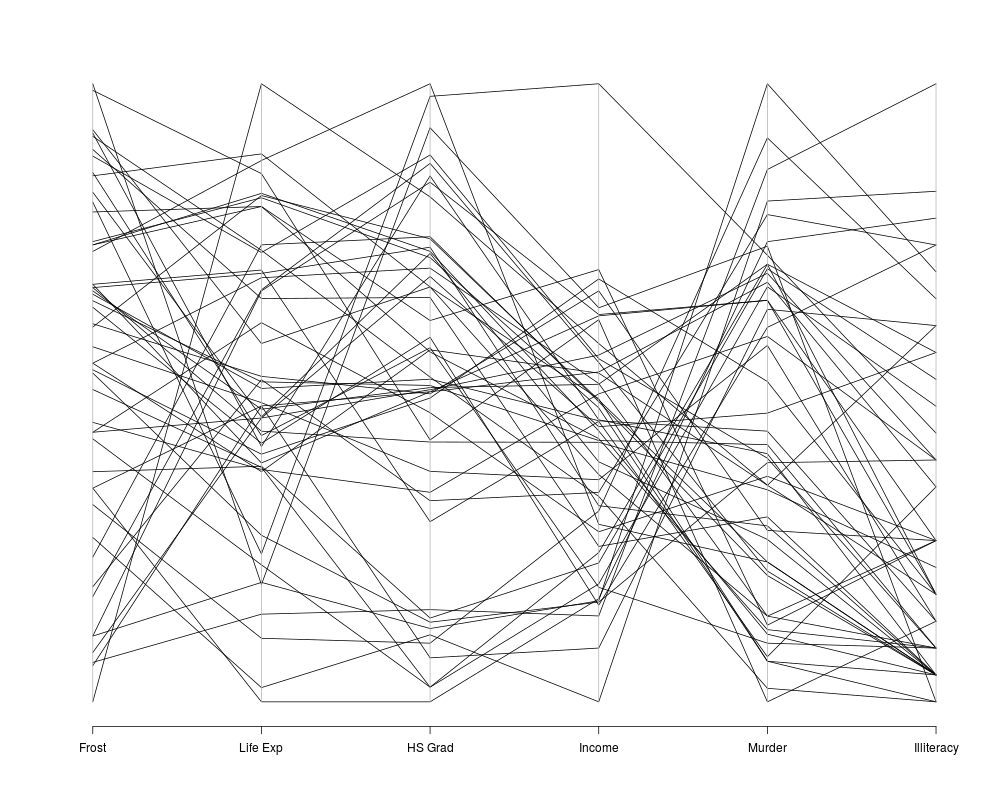
Parallel Coordinates PlotDescriptionParallel coordinates plot Usageparcoord(x, col = 1, lty = 1, var.label = FALSE, ...) Arguments
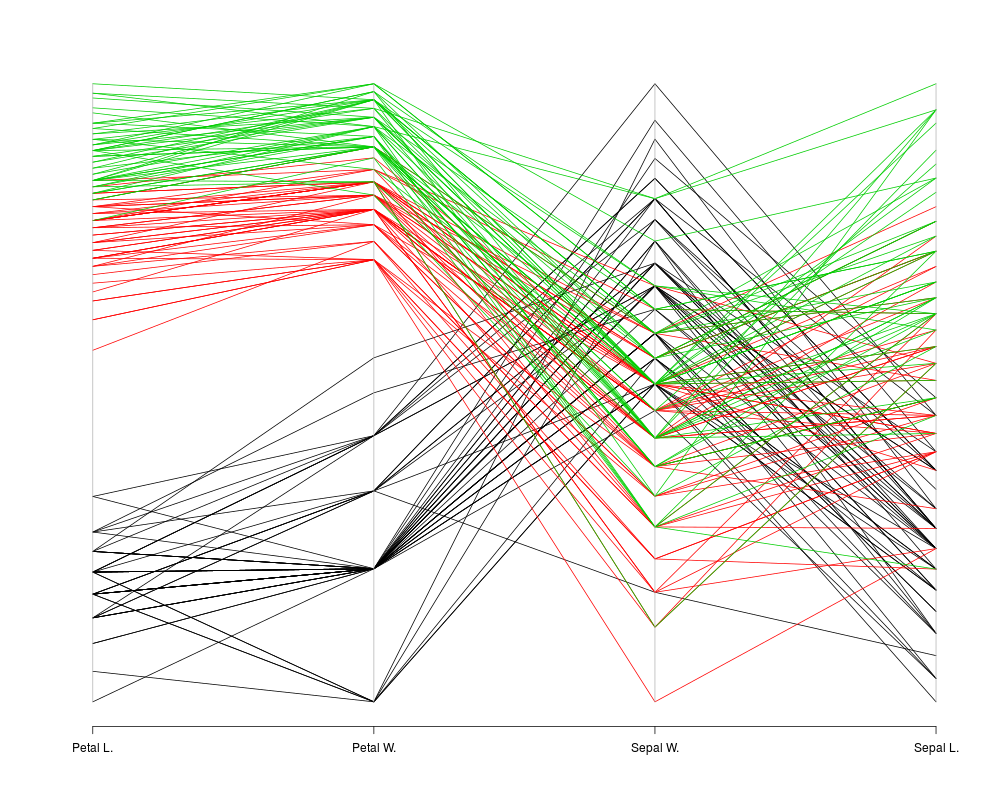
Side Effectsa parallel coordinates plots is drawn. Author(s)B. D. Ripley. Enhancements based on ideas and code by Fabian Scheipl. ReferencesWegman, E. J. (1990) Hyperdimensional data analysis using parallel coordinates. Journal of the American Statistical Association 85, 664–675. Venables, W. N. and Ripley, B. D. (2002) Modern Applied Statistics with S. Fourth edition. Springer. Examplesparcoord(state.x77[, c(7, 4, 6, 2, 5, 3)]) ir <- rbind(iris3[,,1], iris3[,,2], iris3[,,3]) parcoord(log(ir)[, c(3, 4, 2, 1)], col = 1 + (0:149)%/%50) Results
R version 3.3.1 (2016-06-21) -- "Bug in Your Hair"
Copyright (C) 2016 The R Foundation for Statistical Computing
Platform: x86_64-pc-linux-gnu (64-bit)

R is free software and comes with ABSOLUTELY NO WARRANTY.
You are welcome to redistribute it under certain conditions.
Type 'license()' or 'licence()' for distribution details.

R is a collaborative project with many contributors.
Type 'contributors()' for more information and
'citation()' on how to cite R or R packages in publications.

Type 'demo()' for some demos, 'help()' for on-line help, or
'help.start()' for an HTML browser interface to help.
Type 'q()' to quit R.

> library(MASS)
> png(filename="/home/ddbj/snapshot/RGM3/R_CC/result/MASS/parcoord.Rd_%03d_medium.png", width=480, height=480)
> ### Name: parcoord
> ### Title: Parallel Coordinates Plot
> ### Aliases: parcoord
> ### Keywords: hplot
>
> ### ** Examples
>
> parcoord(state.x77[, c(7, 4, 6, 2, 5, 3)])
>
> ir <- rbind(iris3[,,1], iris3[,,2], iris3[,,3])
> parcoord(log(ir)[, c(3, 4, 2, 1)], col = 1 + (0:149)%/%50)
>
>
>
>
>
> dev.off()
null device
          1
>
|