Supported by Dr. Osamu Ogasawara and  . . |
|
Last data update: 2014.03.03 |
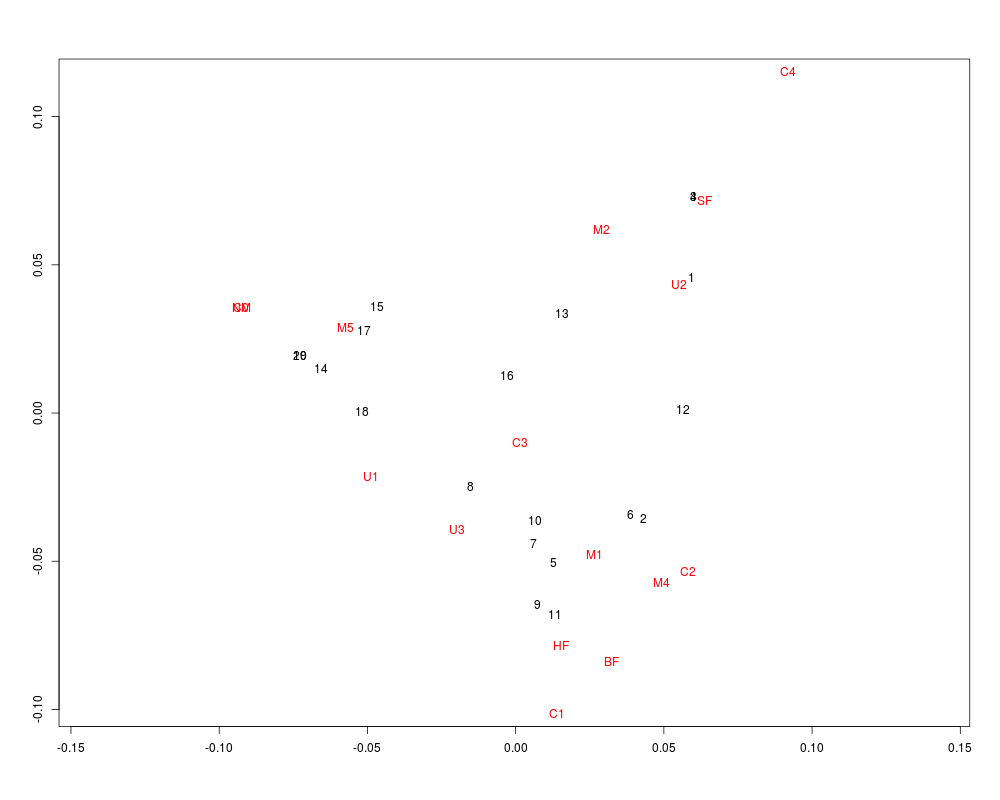
Plot Method for Objects of Class 'mca'DescriptionPlot a multiple correspondence analysis. Usage
## S3 method for class 'mca'
plot(x, rows = TRUE, col, cex = par("cex"), ...)
Arguments
ReferencesVenables, W. N. and Ripley, B. D. (2002) Modern Applied Statistics with S. Fourth edition. Springer. See Also
Examplesplot(mca(farms, abbrev = TRUE)) Results
R version 3.3.1 (2016-06-21) -- "Bug in Your Hair"
Copyright (C) 2016 The R Foundation for Statistical Computing
Platform: x86_64-pc-linux-gnu (64-bit)

R is free software and comes with ABSOLUTELY NO WARRANTY.
You are welcome to redistribute it under certain conditions.
Type 'license()' or 'licence()' for distribution details.

R is a collaborative project with many contributors.
Type 'contributors()' for more information and
'citation()' on how to cite R or R packages in publications.

Type 'demo()' for some demos, 'help()' for on-line help, or
'help.start()' for an HTML browser interface to help.
Type 'q()' to quit R.

> library(MASS)
> png(filename="/home/ddbj/snapshot/RGM3/R_CC/result/MASS/plot.mca.Rd_%03d_medium.png", width=480, height=480)
> ### Name: plot.mca
> ### Title: Plot Method for Objects of Class 'mca'
> ### Aliases: plot.mca
> ### Keywords: hplot multivariate
>
> ### ** Examples
>
> plot(mca(farms, abbrev = TRUE))
>
>
>
>
>
> dev.off()
null device
          1
>
|
Created & Maintained by Osamu Ogasawara (osamu.ogasawara@gmail.com) and 