Supported by Dr. Osamu Ogasawara and  . . |
|
Last data update: 2014.03.03 |
Sammon's Non-Linear MappingDescriptionOne form of non-metric multidimensional scaling. Usage
sammon(d, y = cmdscale(d, k), k = 2, niter = 100, trace = TRUE,
       magic = 0.2, tol = 1e-4)
Arguments
DetailsThis chooses a two-dimensional configuration to minimize the stress, the sum of squared differences between the input distances and those of the configuration, weighted by the distances, the whole sum being divided by the sum of input distances to make the stress scale-free. An iterative algorithm is used, which will usually converge in around
50 iterations. As this is necessarily an O(n^2) calculation, it is slow
for large datasets. Further, since the configuration is only determined
up to rotations and reflections (by convention the centroid is at the
origin), the result can vary considerably from machine to machine.
In this release the algorithm has been modified by adding a step-length
search ( ValueTwo components:
Side EffectsIf trace is true, the initial stress and the current stress are printed out every 10 iterations. ReferencesSammon, J. W. (1969) A non-linear mapping for data structure analysis. IEEE Trans. Comput., C-18 401–409. Ripley, B. D. (1996) Pattern Recognition and Neural Networks. Cambridge University Press. Venables, W. N. and Ripley, B. D. (2002) Modern Applied Statistics with S. Fourth edition. Springer. See Also
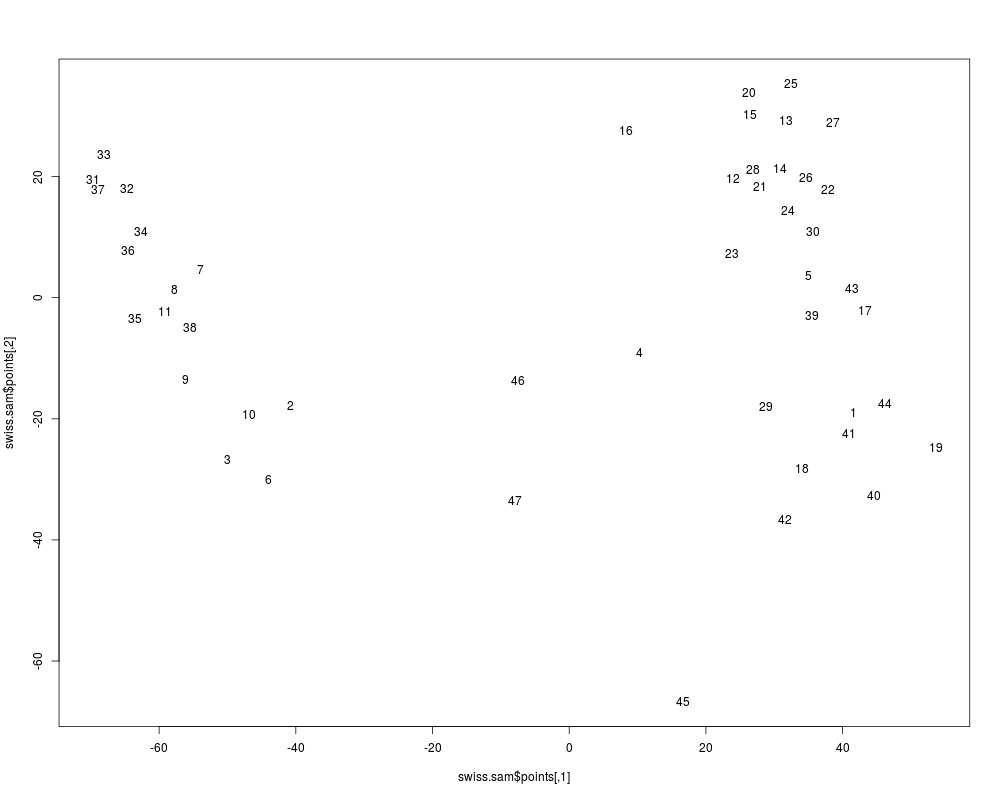
Examplesswiss.x <- as.matrix(swiss[, -1]) swiss.sam <- sammon(dist(swiss.x)) plot(swiss.sam$points, type = "n") text(swiss.sam$points, labels = as.character(1:nrow(swiss.x))) Results
R version 3.3.1 (2016-06-21) -- "Bug in Your Hair"
Copyright (C) 2016 The R Foundation for Statistical Computing
Platform: x86_64-pc-linux-gnu (64-bit)

R is free software and comes with ABSOLUTELY NO WARRANTY.
You are welcome to redistribute it under certain conditions.
Type 'license()' or 'licence()' for distribution details.

R is a collaborative project with many contributors.
Type 'contributors()' for more information and
'citation()' on how to cite R or R packages in publications.

Type 'demo()' for some demos, 'help()' for on-line help, or
'help.start()' for an HTML browser interface to help.
Type 'q()' to quit R.

> library(MASS)
> png(filename="/home/ddbj/snapshot/RGM3/R_CC/result/MASS/sammon.Rd_%03d_medium.png", width=480, height=480)
> ### Name: sammon
> ### Title: Sammon's Non-Linear Mapping
> ### Aliases: sammon
> ### Keywords: multivariate
>
> ### ** Examples
>
> swiss.x <- as.matrix(swiss[, -1])
> swiss.sam <- sammon(dist(swiss.x))
Initial stress        : 0.00824
stress after  10 iters: 0.00439, magic = 0.338
stress after  20 iters: 0.00383, magic = 0.500
stress after  30 iters: 0.00383, magic = 0.500
> plot(swiss.sam$points, type = "n")
> text(swiss.sam$points, labels = as.character(1:nrow(swiss.x)))
>
>
>
>
>
> dev.off()
null device
          1
>
|