Supported by Dr. Osamu Ogasawara and  . . |
|
Last data update: 2014.03.03 |
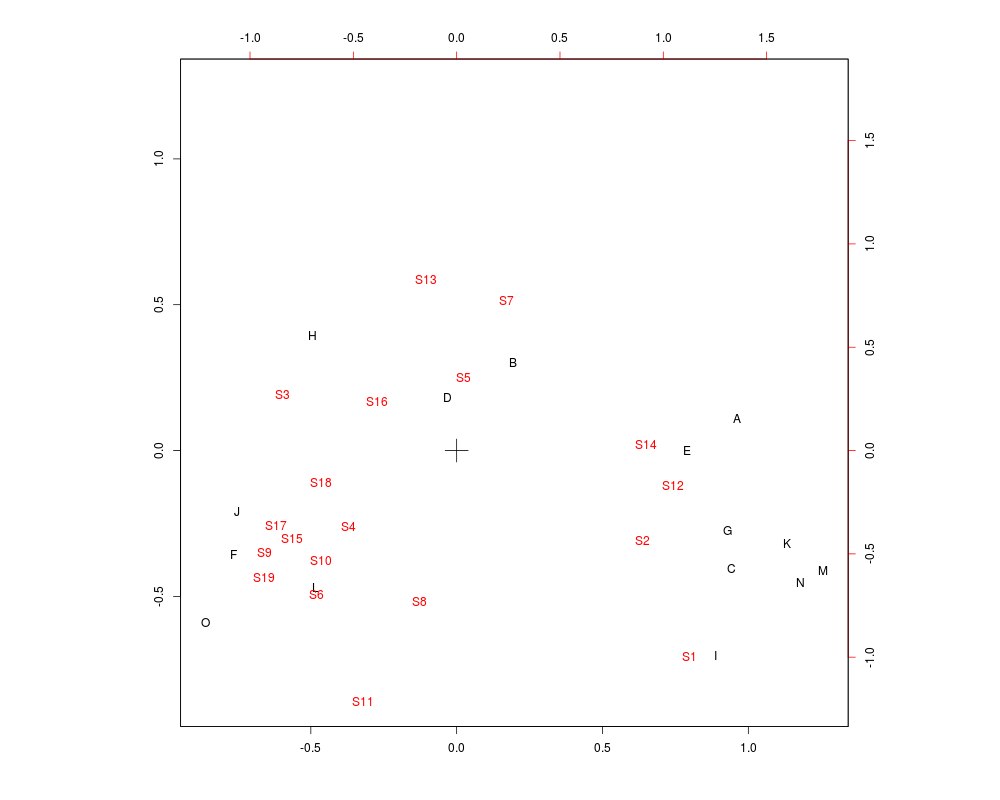
Counts of Waders at 15 Sites in South AfricaDescriptionThe Usagewaders FormatThis data frame contains the following columns (species)
The rows are the sites: A = Namibia North coast SourceJ.C. Gower and D.J. Hand (1996) Biplots Chapman & Hall Table 9.1. Quoted as from: R.W. Summers, L.G. Underhill, D.J. Pearson and D.A. Scott (1987) Wader migration systems in south and eastern Africa and western Asia. Wader Study Group Bulletin 49 Supplement, 15–34. Examplesplot(corresp(waders, nf=2)) Results
R version 3.3.1 (2016-06-21) -- "Bug in Your Hair"
Copyright (C) 2016 The R Foundation for Statistical Computing
Platform: x86_64-pc-linux-gnu (64-bit)

R is free software and comes with ABSOLUTELY NO WARRANTY.
You are welcome to redistribute it under certain conditions.
Type 'license()' or 'licence()' for distribution details.

R is a collaborative project with many contributors.
Type 'contributors()' for more information and
'citation()' on how to cite R or R packages in publications.

Type 'demo()' for some demos, 'help()' for on-line help, or
'help.start()' for an HTML browser interface to help.
Type 'q()' to quit R.

> library(MASS)
> png(filename="/home/ddbj/snapshot/RGM3/R_CC/result/MASS/waders.Rd_%03d_medium.png", width=480, height=480)
> ### Name: waders
> ### Title: Counts of Waders at 15 Sites in South Africa
> ### Aliases: waders
> ### Keywords: datasets
>
> ### ** Examples
>
> plot(corresp(waders, nf=2))
>
>
>
>
>
> dev.off()
null device
          1
>
|