Supported by Dr. Osamu Ogasawara and  . . |
|
Last data update: 2014.03.03 |
Meta Regression ScatterplotDescriptionOutputs a scatterplot from a fixed or random effects meta regression (continuous and/or categorical). Usageplotcon(g, var, mod, data, method= "random", modname=NULL, title=NULL, ...) Arguments
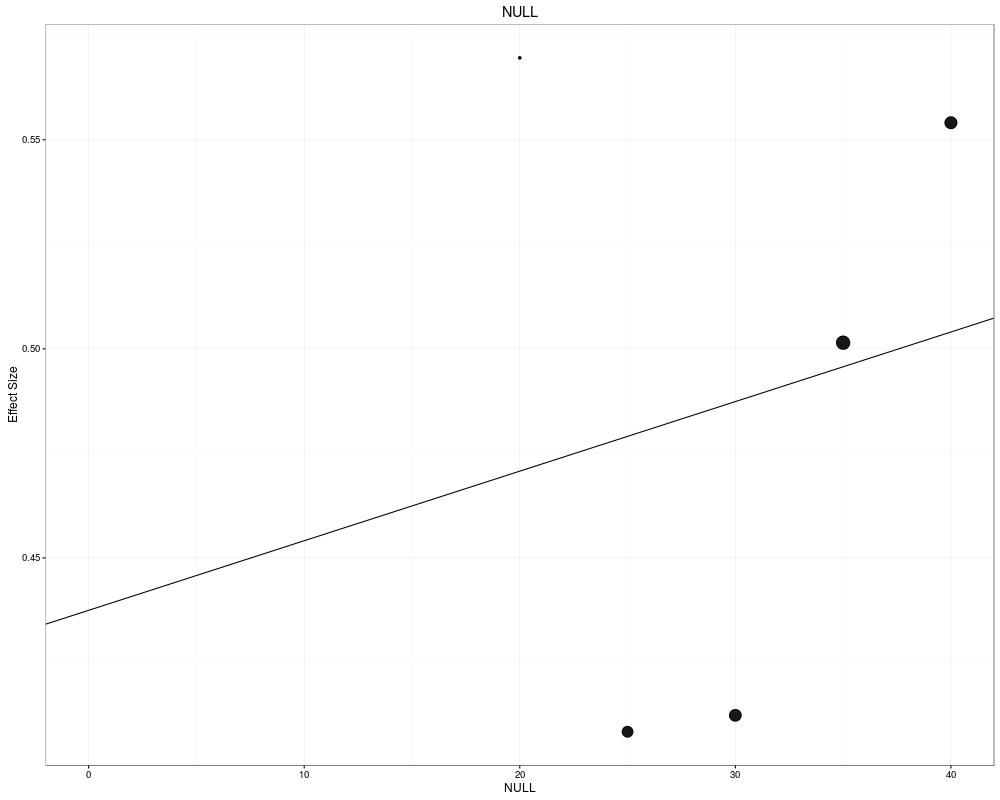
ValueScatterplot with fixed or random effects regression line with size of visual points based on study weights, where the more precise studies have larger points. The ggplot2 package outputs the rich graphics. Author(s)AC Del Re & William T. Hoyt Maintainer: AC Del Re acdelre@gmail.com ReferencesCooper, H., Hedges, L.V., & Valentine, J.C. (2009). The handbook of research synthesis and meta analysis (2nd edition). New York: Russell Sage Foundation. See Also
Examples
# SAMPLE DATA
MA2 <-read.table(textConnection("
id       es1       var1 n.1 n.2 mod1 mod2
1   1 0.5695938 0.04906967  26  30    a   20
2   2 0.4123667 0.04362541  28  34    b   30
3   3 0.4084333 0.04458363  34  28    a   25
4   4 0.5014756 0.04186354  37  29    b   35
5   5 0.5540745 0.04339382  31  32    b   40
6   1 0.5695938 0.04906967  26  30    a   20
7   2 0.4123667 0.04362541  28  34    b   30
8   3 0.4084333 0.04458363  34  28    a   25
9   4 0.5014756 0.04186354  37  29    b   35
10  5 0.5540745 0.04339382  31  32    b   40"))


# EXAMPLE
plotcon(es1, var1, mod2, data=MA2, method= "fixed", modname="NULL",title="NULL")
Results
R version 3.3.1 (2016-06-21) -- "Bug in Your Hair"
Copyright (C) 2016 The R Foundation for Statistical Computing
Platform: x86_64-pc-linux-gnu (64-bit)

R is free software and comes with ABSOLUTELY NO WARRANTY.
You are welcome to redistribute it under certain conditions.
Type 'license()' or 'licence()' for distribution details.

R is a collaborative project with many contributors.
Type 'contributors()' for more information and
'citation()' on how to cite R or R packages in publications.

Type 'demo()' for some demos, 'help()' for on-line help, or
'help.start()' for an HTML browser interface to help.
Type 'q()' to quit R.

> library(MAd)
> png(filename="/home/ddbj/snapshot/RGM3/R_CC/result/MAd/plotcon.rd_%03d_medium.png", width=480, height=480)
> ### Name: plotcon
> ### Title: Meta Regression Scatterplot
> ### Aliases: plotcon
> ### Keywords: aplot
>
> ### ** Examples
>
> # SAMPLE DATA
> MA2 <-read.table(textConnection("
+ id       es1       var1 n.1 n.2 mod1 mod2
+ 1   1 0.5695938 0.04906967  26  30    a   20
+ 2   2 0.4123667 0.04362541  28  34    b   30
+ 3   3 0.4084333 0.04458363  34  28    a   25
+ 4   4 0.5014756 0.04186354  37  29    b   35
+ 5   5 0.5540745 0.04339382  31  32    b   40
+ 6   1 0.5695938 0.04906967  26  30    a   20
+ 7   2 0.4123667 0.04362541  28  34    b   30
+ 8   3 0.4084333 0.04458363  34  28    a   25
+ 9   4 0.5014756 0.04186354  37  29    b   35
+ 10  5 0.5540745 0.04339382  31  32    b   40"))
>
>
> # EXAMPLE
> plotcon(es1, var1, mod2, data=MA2, method= "fixed", modname="NULL",title="NULL")
Loading required package: ggplot2
Loading required package: metafor
Loading required package: Matrix
Loading 'metafor' package (version 1.9-8). For an overview
and introduction to the package please type: help(metafor).
>
>
>
>
>
> dev.off()
null device
          1
>
|