Supported by Dr. Osamu Ogasawara and  . . |
|
Last data update: 2014.03.03 |
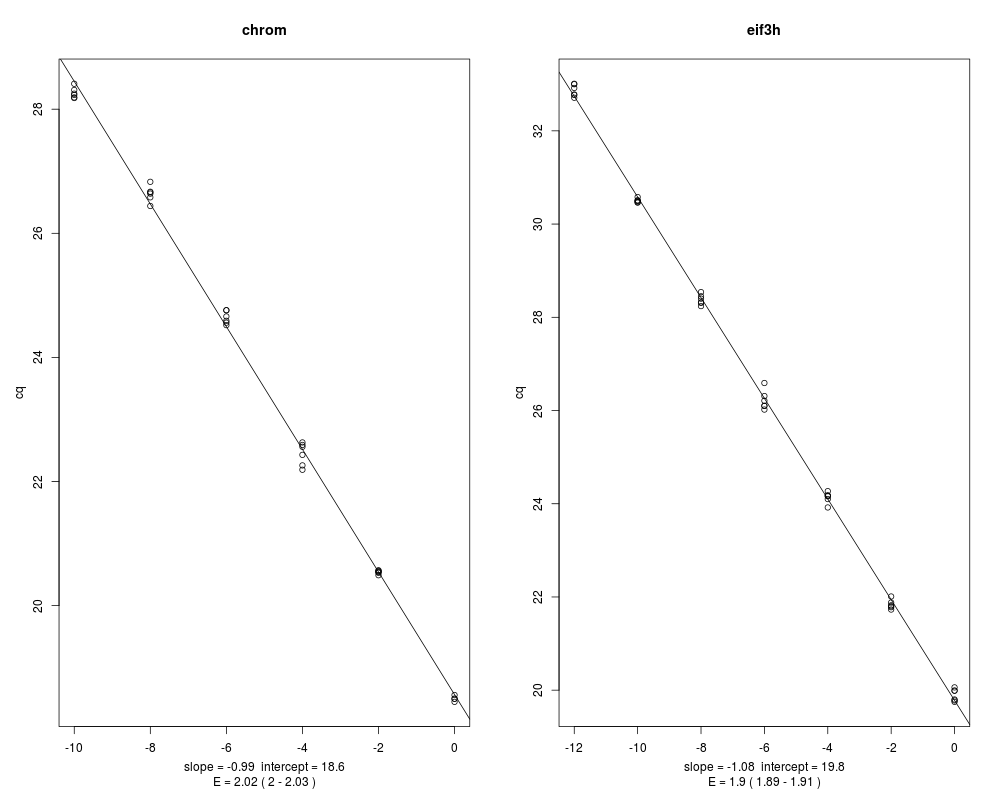
Determines qPCR amplification efficiencies from dilution seriesDescriptionRuns linear regression on Cq versus log2(RNA concentration), plots graph, reports slope (ideally should be -1), and efficiency (with 95 percent credible limits) UsagePrimEff(data, plot = TRUE) Arguments
DetailsRun with at least 8 2-fold dilutions per gene ValuePlots the regression and under it, the values of slope and efficiency (plus and minus one SD). The dataframe may contain data for multiple genes, which will all be plotted together (so the reasonable limit is something like 25 genes) Also returns a dataframe with columns: gene, efficiency, plus one SD, minus one SD, and intercept. Author(s)Mikhail V. Matz, UT Austin <matz@utexas.edu> ReferencesMatz MV, Wright RM, Scott JG (2013) No Control Genes Required: Bayesian Analysis of qRT-PCR Data. PLoS ONE 8(8): e71448. doi:10.1371/journal.pone.0071448 Examplesdata(dilutions) PrimEff(dilutions) Results
R version 3.3.1 (2016-06-21) -- "Bug in Your Hair"
Copyright (C) 2016 The R Foundation for Statistical Computing
Platform: x86_64-pc-linux-gnu (64-bit)

R is free software and comes with ABSOLUTELY NO WARRANTY.
You are welcome to redistribute it under certain conditions.
Type 'license()' or 'licence()' for distribution details.

R is a collaborative project with many contributors.
Type 'contributors()' for more information and
'citation()' on how to cite R or R packages in publications.

Type 'demo()' for some demos, 'help()' for on-line help, or
'help.start()' for an HTML browser interface to help.
Type 'q()' to quit R.

> library(MCMC.qpcr)
Loading required package: MCMCglmm
Loading required package: Matrix
Loading required package: coda
Loading required package: ape
Loading required package: ggplot2
> png(filename="/home/ddbj/snapshot/RGM3/R_CC/result/MCMC.qpcr/PrimEff.Rd_%03d_medium.png", width=480, height=480)
> ### Name: PrimEff
> ### Title: Determines qPCR amplification efficiencies from dilution series
> ### Aliases: PrimEff
>
> ### ** Examples
>
>
> data(dilutions)
> PrimEff(dilutions)
   gene    E E.minus.se E.plus.se intercept
1 chrom 2.02       2.00      2.03      18.6
2 eif3h 1.90       1.89      1.91      19.8
>
>
>
>
>
>
> dev.off()
null device
          1
>
|