Supported by Dr. Osamu Ogasawara and  . . |
|
Last data update: 2014.03.03 |
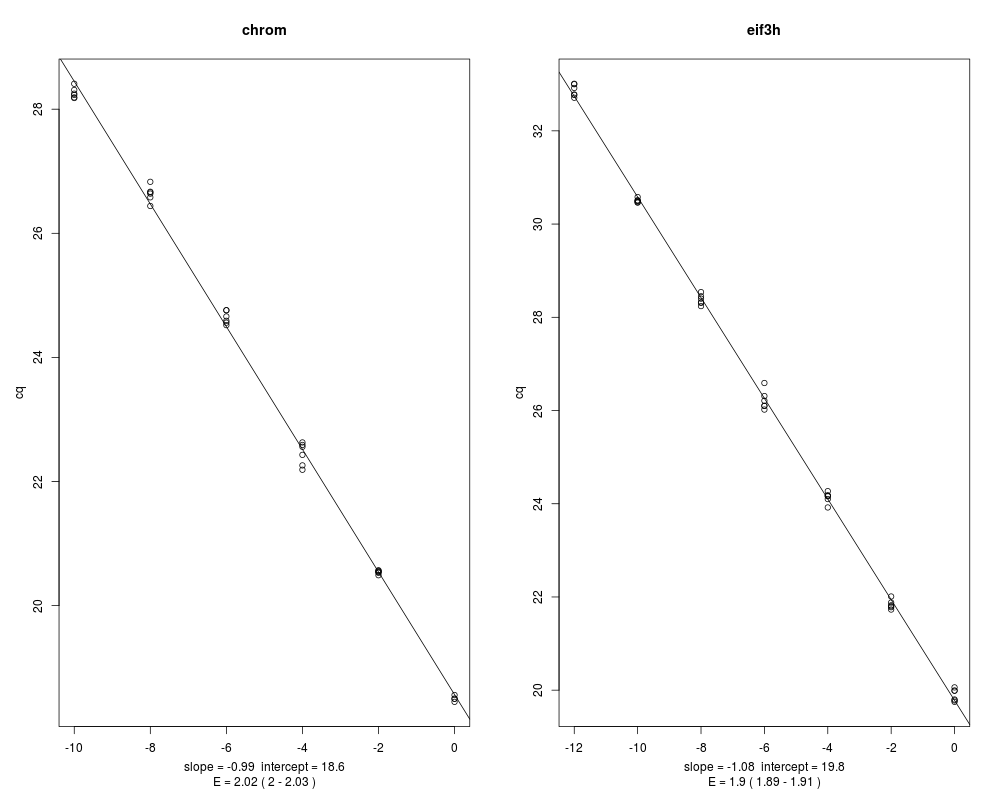
Data to determine amplification efficiencyDescriptionCq data for a series of four-fold dilutions for two targets; the input for PrimEff() Usagedata(dilutions) FormatA data frame with 76 observations on the following 3 variables.
Examplesdata(dilutions) PrimEff(dilutions) Results
R version 3.3.1 (2016-06-21) -- "Bug in Your Hair"
Copyright (C) 2016 The R Foundation for Statistical Computing
Platform: x86_64-pc-linux-gnu (64-bit)

R is free software and comes with ABSOLUTELY NO WARRANTY.
You are welcome to redistribute it under certain conditions.
Type 'license()' or 'licence()' for distribution details.

R is a collaborative project with many contributors.
Type 'contributors()' for more information and
'citation()' on how to cite R or R packages in publications.

Type 'demo()' for some demos, 'help()' for on-line help, or
'help.start()' for an HTML browser interface to help.
Type 'q()' to quit R.

> library(MCMC.qpcr)
Loading required package: MCMCglmm
Loading required package: Matrix
Loading required package: coda
Loading required package: ape
Loading required package: ggplot2
> png(filename="/home/ddbj/snapshot/RGM3/R_CC/result/MCMC.qpcr/dilutions.Rd_%03d_medium.png", width=480, height=480)
> ### Name: dilutions
> ### Title: Data to determine amplification efficiency
> ### Aliases: dilutions
> ### Keywords: datasets
>
> ### ** Examples
>
> data(dilutions)
> PrimEff(dilutions)
   gene    E E.minus.se E.plus.se intercept
1 chrom 2.02       2.00      2.03      18.6
2 eif3h 1.90       1.89      1.91      19.8
>
>
>
>
>
> dev.off()
null device
          1
>
|
Created & Maintained by Osamu Ogasawara (osamu.ogasawara@gmail.com) and 