Supported by Dr. Osamu Ogasawara and  . . |
|
Last data update: 2014.03.03 |
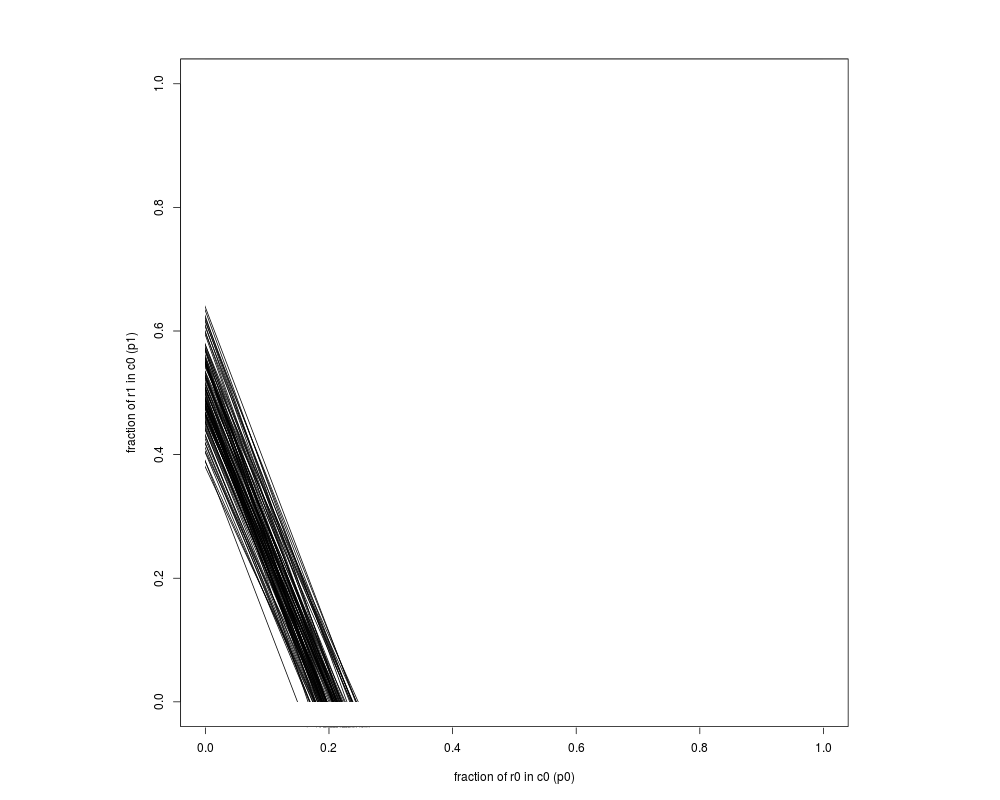
Tomography PlotDescriptiontomogplot is used to produce a tomography plot (see King, 1997) for a series of partially observed 2 x 2 contingency tables. Usage
tomogplot(r0, r1, c0, c1, xlab="fraction of r0 in c0 (p0)",
          ylab="fraction of r1 in c0 (p1)", bgcol="white", ...)
Arguments
DetailsConsider the following partially observed 2 by 2 contingency table:
where r0, r1, c0, c1, and N are non-negative integers that are observed. The interior cell entries are not observed. It is assumed that Y0|r0 ~ Binomial(r0, p0) and Y1|r1 ~ Binomial(r1,p1). This function plots the bounds on the maximum likelihood estimatess for (p0, p1). ReferencesGary King, 1997. A Solution to the Ecological Inference Problem. Princeton: Princeton University Press. Jonathan C. Wakefield. 2004. “Ecological Inference for 2 x 2 Tables.” Journal of the Royal Statistical Society, Series A. 167(3): 385445. See Also
Examplesr0 <- rpois(100, 500) r1 <- rpois(100, 200) c0 <- rpois(100, 100) c1 <- (r0 + r1) - c0 tomogplot(r0, r1, c0, c1) Results
R version 3.3.1 (2016-06-21) -- "Bug in Your Hair"
Copyright (C) 2016 The R Foundation for Statistical Computing
Platform: x86_64-pc-linux-gnu (64-bit)

R is free software and comes with ABSOLUTELY NO WARRANTY.
You are welcome to redistribute it under certain conditions.
Type 'license()' or 'licence()' for distribution details.

R is a collaborative project with many contributors.
Type 'contributors()' for more information and
'citation()' on how to cite R or R packages in publications.

Type 'demo()' for some demos, 'help()' for on-line help, or
'help.start()' for an HTML browser interface to help.
Type 'q()' to quit R.

> library(MCMCpack)
Loading required package: coda
Loading required package: MASS
##
## Markov Chain Monte Carlo Package (MCMCpack)
## Copyright (C) 2003-2016 Andrew D. Martin, Kevin M. Quinn, and Jong Hee Park
##
## Support provided by the U.S. National Science Foundation
## (Grants SES-0350646 and SES-0350613)
##
> png(filename="/home/ddbj/snapshot/RGM3/R_CC/result/MCMCpack/tomog.Rd_%03d_medium.png", width=480, height=480)
> ### Name: tomogplot
> ### Title: Tomography Plot
> ### Aliases: tomogplot
> ### Keywords: hplot
>
> ### ** Examples
>
> r0 <- rpois(100, 500)
> r1 <- rpois(100, 200)
> c0 <- rpois(100, 100)
> c1 <- (r0 + r1) - c0
> tomogplot(r0, r1, c0, c1)
[1] 0
>
>
>
>
>
> dev.off()
null device
          1
>
|