Supported by Dr. Osamu Ogasawara and  . . |
|
Last data update: 2014.03.03 |
Simultaneous confidence intervals for ratios of independent binomial proportionsDescriptionSimultaneous asymptotic CI for contrasts of binomial proportions, assuming that standard normal approximation holds on the log scale. Confidence intervals for ratios of (weighted geometric means) of proportions are calculated based on differences of log-proportions, and normal approximation on the log-scale. UsagebinomRRci(x,...) ## Default S3 method: binomRRci(x, n, names=NULL, type="Dunnett", cmat=NULL, alternative="two.sided", conf.level=0.95, dist="MVN", ...) ## S3 method for class 'formula' binomRRci(formula, data, type="Dunnett", cmat=NULL, alternative="two.sided", conf.level=0.95, dist="MVN",...) ## S3 method for class 'table' binomRRci(x, type="Dunnett", cmat=NULL, alternative="two.sided", conf.level=0.95, dist="MVN",...) ## S3 method for class 'matrix' binomRRci(x, type="Dunnett", cmat=NULL, alternative="two.sided", conf.level=0.95, dist="MVN",...) Arguments
DetailsThe interval for the ratio of two independent proportions, described in section "Crude Methods using first-order variance estimation" in Gart and Nam (1988) are extended to multiple contrasts. Confidence intervals are constructed based on contrasts for differences of lp=log (x+0.5)/(n+0.5), using quantiles of the multivariate normal or normal approximation. Applying the exponential functions to the bounds results in intervals for the risk ratio. In case that 0 occur in both, the numerator and denominator of the ratio, the interval is expanded to [0,Inf], in case that only 0s numerator go to the numerator, the lower bound is expanded to 0, in case that only 0s go to the denominator, the upper bound is expanded to Inf. See the examples for different usages. ValueA object of class "binomRDci", a list containing:
NoteNote, that all implemented methods are approximate only. The coverage probability of the intervals might seriously deviate from the nominal level for small sample sizes and extreme success probabilities. ReferencesGart, JJ and Nam,J-m (1988): Approximate interval estimation of the ratio of binomial parameters: a review and corrections for skewness. Biometrics 44, 323-338. See Alsosummary.binomRDci for the risk difference, summary.binomORci for the odds ratio, plot.sci for plotting Examples
# In simple cases, counts of successes
# and number of trials can be just typed:
ntrials <- c(40,20,20,20)
xsuccesses <- c(1,2,2,4)
names(xsuccesses) <- LETTERS[1:4]
ex1D<-binomRRci(x=xsuccesses, n=ntrials,
type="Dunnett")
ex1D
ex1W<-binomRRci(x=xsuccesses, n=ntrials,
type="Williams", alternative="greater")
ex1W
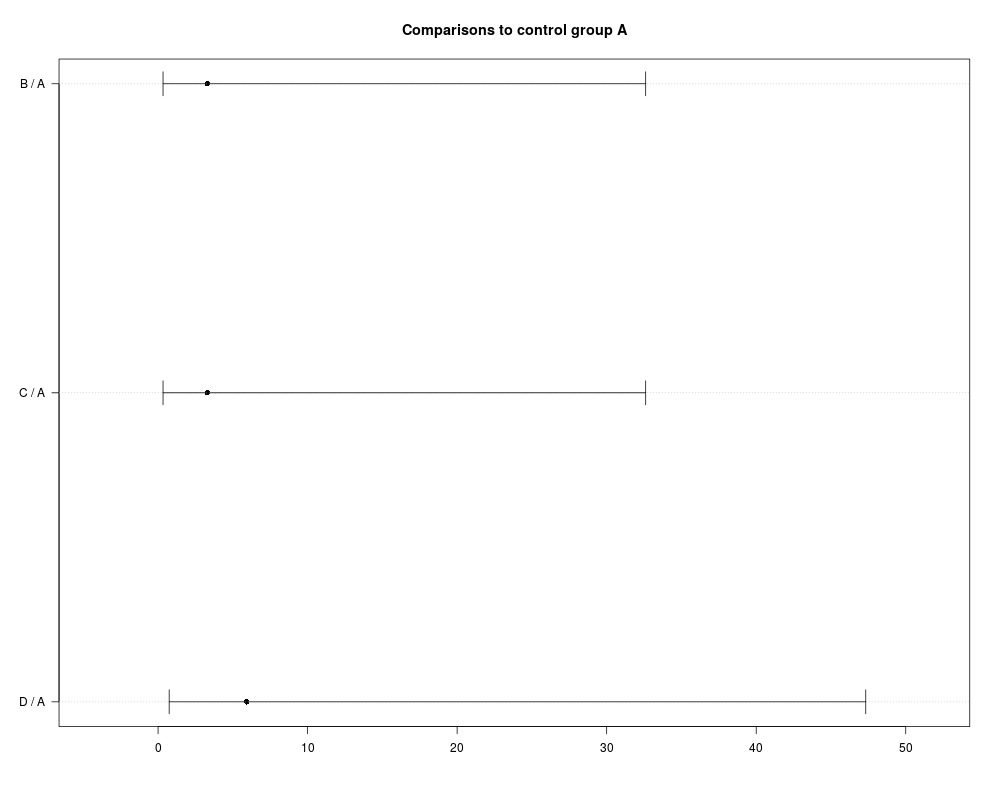
# results can be plotted:
plot(ex1D, main="Comparisons to control group A")
# summary gives a more detailed print out:
summary(ex1W)
# if data are represented as dichotomous variable
# in a data.frame one can make use of table:
data(liarozole)
head(liarozole)
# here, it might be important to define which level of the
# variable 'Improved' is to be considered as success
binomRRci(Improved ~ Treatment, data=liarozole,
type="Dunnett", success="y", base=4, alternative="greater")
# If data are available as a named kx2-contigency table:
tab<-table(liarozole)
tab
binomRRci(tab, type="Dunnett", success="y", base=4, alternative="greater")
# Performance for extreme cases:
binomRRci(x=c(0,0,20,5),n=c(20,20,20,20),names=c("A","B","C","D"),
type="Dunnett", alternative="greater")
Results
R version 3.3.1 (2016-06-21) -- "Bug in Your Hair"
Copyright (C) 2016 The R Foundation for Statistical Computing
Platform: x86_64-pc-linux-gnu (64-bit)

R is free software and comes with ABSOLUTELY NO WARRANTY.
You are welcome to redistribute it under certain conditions.
Type 'license()' or 'licence()' for distribution details.

R is a collaborative project with many contributors.
Type 'contributors()' for more information and
'citation()' on how to cite R or R packages in publications.

Type 'demo()' for some demos, 'help()' for on-line help, or
'help.start()' for an HTML browser interface to help.
Type 'q()' to quit R.

> library(MCPAN)
> png(filename="/home/ddbj/snapshot/RGM3/R_CC/result/MCPAN/binomRRci.Rd_%03d_medium.png", width=480, height=480)
> ### Name: binomRRci
> ### Title: Simultaneous confidence intervals for ratios of independent
> ###   binomial proportions
> ### Aliases: binomRRci binomRRci.default binomRRci.table binomRRci.matrix
> ###   binomRRci.formula
> ### Keywords: htest
>
> ### ** Examples
>
>
> # In simple cases, counts of successes
> # and number of trials can be just typed:
>
> ntrials <- c(40,20,20,20)
> xsuccesses <- c(1,2,2,4)
> names(xsuccesses) <- LETTERS[1:4]
> ex1D<-binomRRci(x=xsuccesses, n=ntrials,
+  type="Dunnett")
> ex1D
Simultaneous 95 percent-confidence intervals
 for the ratio of proportions (RR), based on a crude normal approximation
      estimate  lower   upper
B / A   3.2927 0.3323 32.6256
C / A   3.2927 0.3323 32.6256
D / A   5.9268 0.7419 47.3476

where proportions are the probabilities to observe success

>
> ex1W<-binomRRci(x=xsuccesses, n=ntrials,
+  type="Williams", alternative="greater")
> ex1W
Simultaneous 95 percent-confidence intervals
 for the ratio of proportions (RR), based on a crude normal approximation
    estimate  lower upper
C 1   5.9268 1.1251   Inf
C 2   4.4176 0.8760   Inf
C 3   4.0054 0.8232   Inf

where proportions are the probabilities to observe success

>
> # results can be plotted:
> plot(ex1D, main="Comparisons to control group A")
>
> # summary gives a more detailed print out:
> summary(ex1W)
Summary statistics:
                                   A    B    C    D
number of successes            1.000  2.0  2.0  4.0
number of trials              40.000 20.0 20.0 20.0
estimated success probability  0.025  0.1  0.1  0.2

 Contrast matrix:

	 Multiple Comparisons of Means: Williams Contrasts

     A      B      C      D
C 1 -1 0.0000 0.0000 1.0000
C 2 -1 0.0000 0.5000 0.5000
C 3 -1 0.3333 0.3333 0.3333

 The estimated correlation matrix of the contrasts is:
       [,1]   [,2]   [,3]
[1,] 1.0000 0.9178 0.9013
[2,] 0.9178 1.0000 0.9648
[3,] 0.9013 0.9648 1.0000

Simultaneous 95 percent-confidence intervals
 for the ratio of proportions (RR), based on a crude normal approximation
    estimate  lower upper
C 1   5.9268 1.1251   Inf
C 2   4.4176 0.8760   Inf
C 3   4.0054 0.8232   Inf

where proportions are the probabilities to observe success

>
> # if data are represented as dichotomous variable
> # in a data.frame one can make use of table:
>
>
> data(liarozole)
>
> head(liarozole)
  Improved Treatment
1        y   Placebo
2        y   Placebo
3        n   Placebo
4        n   Placebo
5        n   Placebo
6        n   Placebo
>
> # here, it might be important to define which level of the
> # variable 'Improved' is to be considered as success
>
> binomRRci(Improved ~ Treatment, data=liarozole,
+  type="Dunnett", success="y", base=4, alternative="greater")
Simultaneous 95 percent-confidence intervals
 for the ratio of proportions (RR), based on a crude normal approximation
                  estimate  lower upper
Dose150 / Placebo   5.4000 1.5144   Inf
Dose50 / Placebo    2.6776 0.6691   Inf
Dose75 / Placebo    1.7014 0.3863   Inf

where proportions are the probabilities to observe y

>
> # If data are available as a named kx2-contigency table:
>
> tab<-table(liarozole)
> tab
        Treatment
Improved Dose150 Dose50 Dose75 Placebo
       n      21     27     32      32
       y      13      6      4       2
>
> binomRRci(tab, type="Dunnett", success="y", base=4, alternative="greater")
Simultaneous 95 percent-confidence intervals
 for the ratio of proportions (RR), based on a crude normal approximation
                  estimate  lower upper
Dose150 / Placebo   5.4000 1.5132   Inf
Dose50 / Placebo    2.6776 0.6686   Inf
Dose75 / Placebo    1.7014 0.3859   Inf

where proportions are the probabilities to observe y

>
>
> # Performance for extreme cases:
>
>
> binomRRci(x=c(0,0,20,5),n=c(20,20,20,20),names=c("A","B","C","D"),
+  type="Dunnett", alternative="greater")
Simultaneous 95 percent-confidence intervals
 for the ratio of proportions (RR), based on a crude normal approximation
      estimate  lower upper
B / A        1 0.0000   Inf
C / A       41 2.7836   Inf
D / A       11 0.6824   Inf

where proportions are the probabilities to observe success

Warning messages:
1: In binomRRci.default(x = c(0, 0, 20, 5), n = c(20, 20, 20, 20),  :
  Normal approximation might be inappropriate
2: In restrictbounds(x = x, cmat = cmat, conf.int = conf.int) :
  0 occured in the data and the risk ratio might not be defined
>
>
>
>
>
>
>
> dev.off()
null device
          1
>
|