Supported by Dr. Osamu Ogasawara and  . . |
|
Last data update: 2014.03.03 |
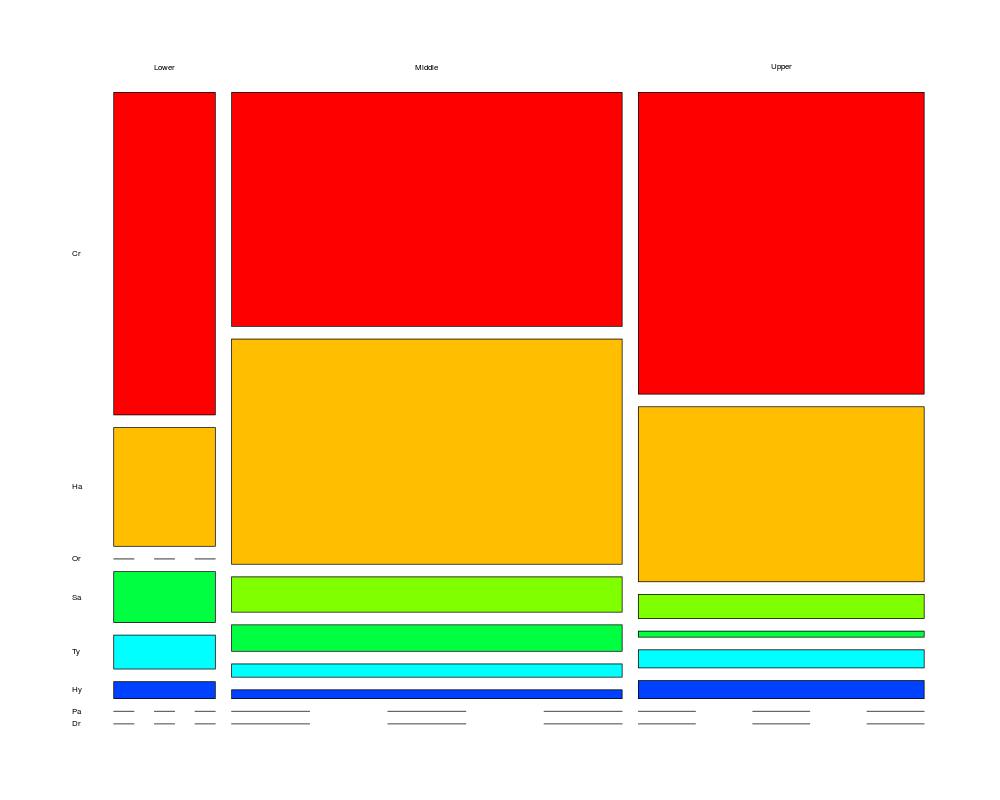
Mosaicplot for the data in Shannonci and SimpsonciDescriptionCreate a mosaicplot from objects of class Shannonci or Simpsonci Usagemosaicdiv(x, decreasing = NULL, ...) Arguments
DetailsThis function uses the counts in [["sample.estimate"]][["table"]] to produce a mosaicplot. ValueA plot. Examplesdata(HCD) HCDFam <- HCD[,-1] SCI<-Simpsonci(X=HCDFam, f=HCD[,1]) mosaicdiv(SCI, decreasing=TRUE, col=rainbow(n=8)) Results
R version 3.3.1 (2016-06-21) -- "Bug in Your Hair"
Copyright (C) 2016 The R Foundation for Statistical Computing
Platform: x86_64-pc-linux-gnu (64-bit)

R is free software and comes with ABSOLUTELY NO WARRANTY.
You are welcome to redistribute it under certain conditions.
Type 'license()' or 'licence()' for distribution details.

R is a collaborative project with many contributors.
Type 'contributors()' for more information and
'citation()' on how to cite R or R packages in publications.

Type 'demo()' for some demos, 'help()' for on-line help, or
'help.start()' for an HTML browser interface to help.
Type 'q()' to quit R.

> library(MCPAN)
> png(filename="/home/ddbj/snapshot/RGM3/R_CC/result/MCPAN/mosaicplot.Shannonci.Rd_%03d_medium.png", width=480, height=480)
> ### Name: mosaicdiv
> ### Title: Mosaicplot for the data in Shannonci and Simpsonci
> ### Aliases: mosaicdiv
> ### Keywords: hplot
>
> ### ** Examples
>
>
> data(HCD)
>
> HCDFam <- HCD[,-1]
>
> SCI<-Simpsonci(X=HCDFam, f=HCD[,1])
>
> mosaicdiv(SCI, decreasing=TRUE, col=rainbow(n=8))
Warning message:
In if (!class(x) %in% c("Shannonci", "Simpsonci")) { :
  the condition has length > 1 and only the first element will be used
>
>
>
>
>
>
> dev.off()
null device
          1
>
|
Created & Maintained by Osamu Ogasawara (osamu.ogasawara@gmail.com) and 