Supported by Dr. Osamu Ogasawara and  . . |
|
Last data update: 2014.03.03 |
Plot confidence intervalsDescriptionA function for convenient plotting of confidence intervals. Usage## Default S3 method: plotCI(x, ...) ## S3 method for class 'sci' plotCI(x, ...) ## S3 method for class 'sci.ratio' plotCI(x, ...) ## S3 method for class 'confint.glht' plotCI(x, ...) Arguments
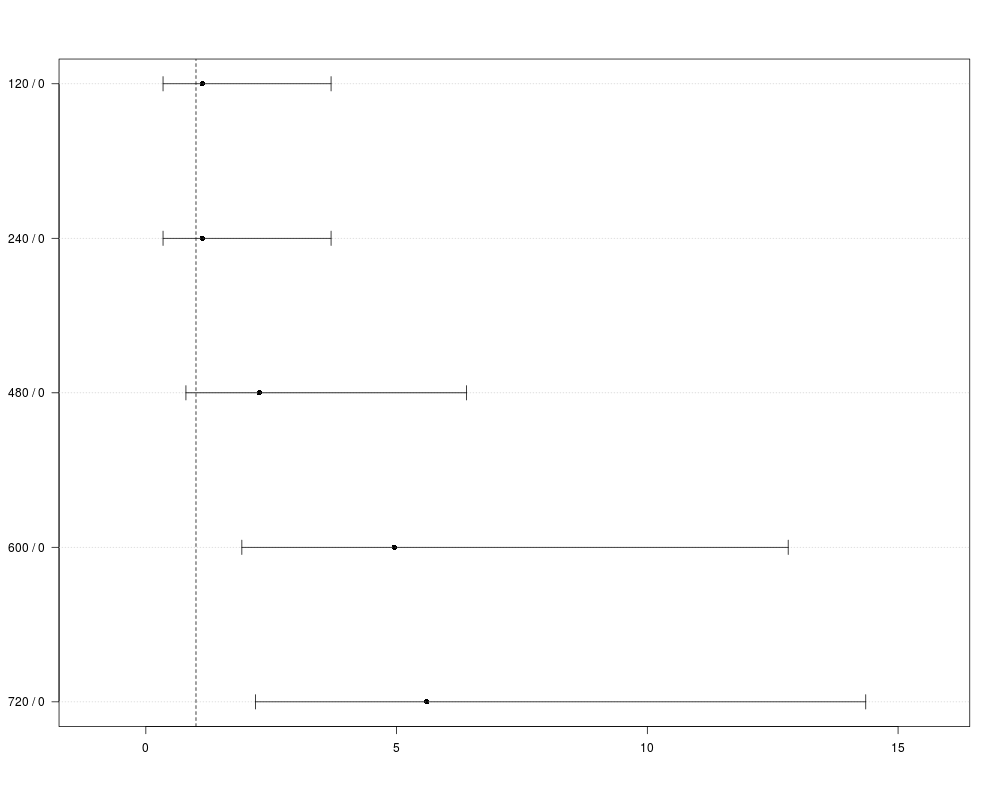
DetailsPlots the estimates, upper and lower limits using points and segments. The names of estimate are passed as labels of the confidence intervals. If infinite bounds occur, the plot region is limited by the most extreme non infinite bound or estimate. ValueA plot. See AlsoInternally, the function plotCII is used. Examples
x=c(8,9,9,18,39,44)
n=c(2000,2000,2000,2000,2000,2000)

x<-binomORci(x=x, n=n, names=c("0","120","240","480","600","720"))

plotCI(x, lines=1)
Results
R version 3.3.1 (2016-06-21) -- "Bug in Your Hair"
Copyright (C) 2016 The R Foundation for Statistical Computing
Platform: x86_64-pc-linux-gnu (64-bit)

R is free software and comes with ABSOLUTELY NO WARRANTY.
You are welcome to redistribute it under certain conditions.
Type 'license()' or 'licence()' for distribution details.

R is a collaborative project with many contributors.
Type 'contributors()' for more information and
'citation()' on how to cite R or R packages in publications.

Type 'demo()' for some demos, 'help()' for on-line help, or
'help.start()' for an HTML browser interface to help.
Type 'q()' to quit R.

> library(MCPAN)
> png(filename="/home/ddbj/snapshot/RGM3/R_CC/result/MCPAN/plotCI.Rd_%03d_medium.png", width=480, height=480)
> ### Name: plotCI
> ### Title: Plot confidence intervals
> ### Aliases: plotCI plotCI.default plotCI.sci plotCI.sci.ratio
> ###   plotCI.confint.glht
> ### Keywords: hplot
>
> ### ** Examples
>
>
> x=c(8,9,9,18,39,44)
> n=c(2000,2000,2000,2000,2000,2000)
>
> x<-binomORci(x=x, n=n, names=c("0","120","240","480","600","720"))
>
> plotCI(x, lines=1)
>
>
>
>
>
>
>
> dev.off()
null device
          1
>
|
Created & Maintained by Osamu Ogasawara (osamu.ogasawara@gmail.com) and 