a (named) numeric vector, the names of the elements are taken as labels of the CI
lower
an optional numeric vector, of the same length as estimate
upper
an optional numeric vector, of the same length as estimate
alternative
a single character string, one of "two.sided", "less", "greater"
lines
an optional numeric (vector) giving the position(s) of line(s) to draw into the plots orthogonal to the confidence intervals
lineslty
possible a vector of line type of the lines, see the options for lty in par
lineslwd
possible a vector of line width of the lines, see the options for lwd in par
linescol
possible a vector of line colors of the lines
CIvert
logical indicating, whether confidence intervals shall be drawn horizontal (default), or vertical (if set to TRUE)
CIlty
single value, to specify the line type used for the CI, see options for lty in ?par
CIlwd
single value, to specify the width type used for the CI, see options for lty in ?par
CIcex
single value, to specify the extension of sympols in the plot, see options for cex in ?par
CIcol
single value, to specify the color used for the CI
CIlength
single numeric value, to be passed to the argument length in function arrows; to specify the lengths of the CI bounds (in inches); defaults to 0.08 and 0.05 for less than 25 and more than 25 CIs, respectively
HL
a logical, if TRUE (default), plot margins of the are adjusted depending on the length of the names by appropriate calls to par; this might be incompatible with combining the plot with others in the same device. If set to FALSE,
its up to the user to choose appropriate plot margins by calling to par.
...
further arguments to be passed to plot
See Also
plotCI, for more convenient methods
Examples
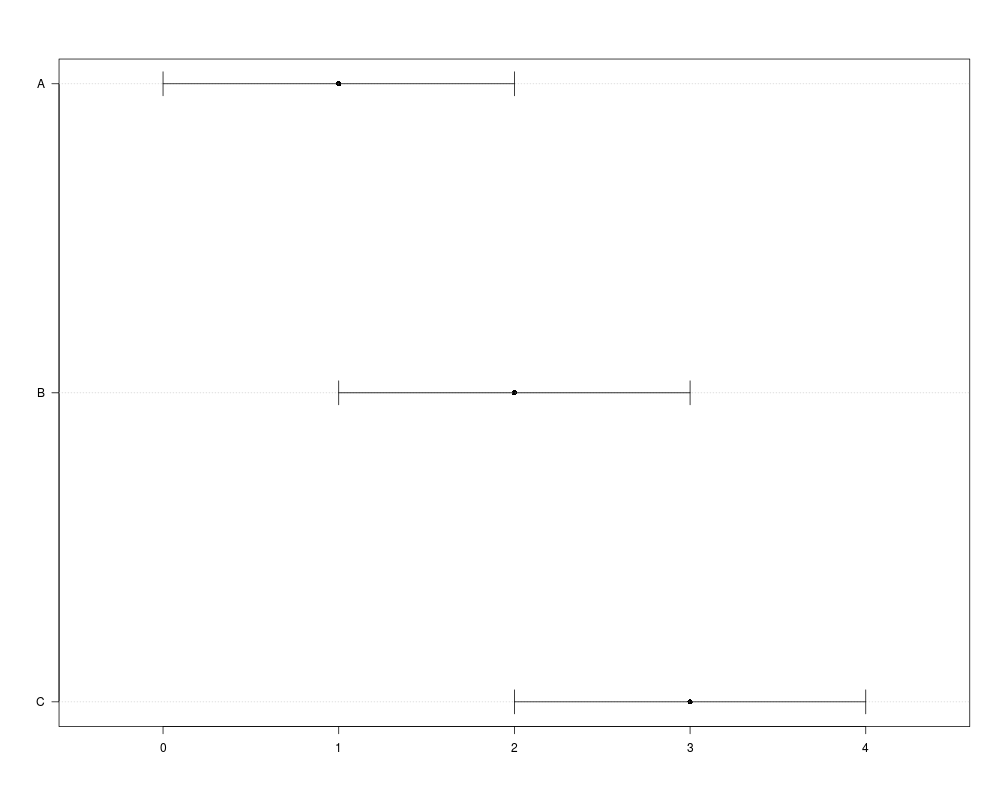
est<-c(1,2,3)
names(est)<-c("A", "B", "C")
lw=c(0,1,2)
up=c(2,3,4)
plotCII(estimate=est, lower=lw, upper=up)
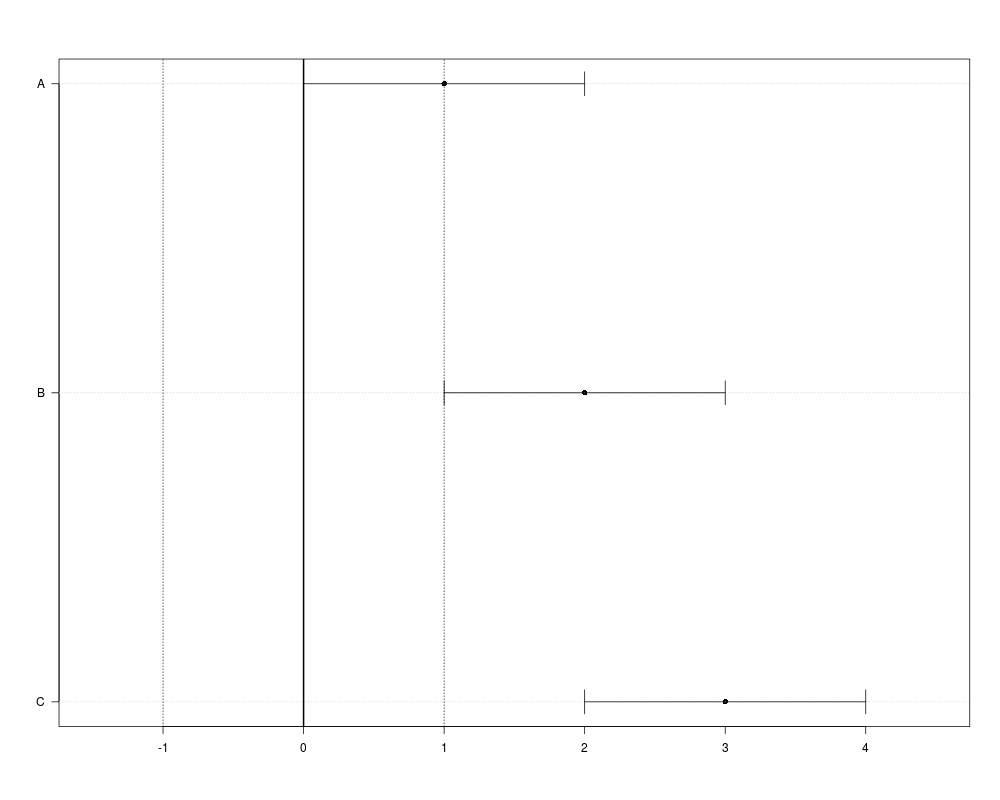
plotCII(estimate=est, lower=lw, upper=up,
lines=c(-1,0,1),
lineslty=c(3,1,3),
lineslwd=c(1,2,1))
###########
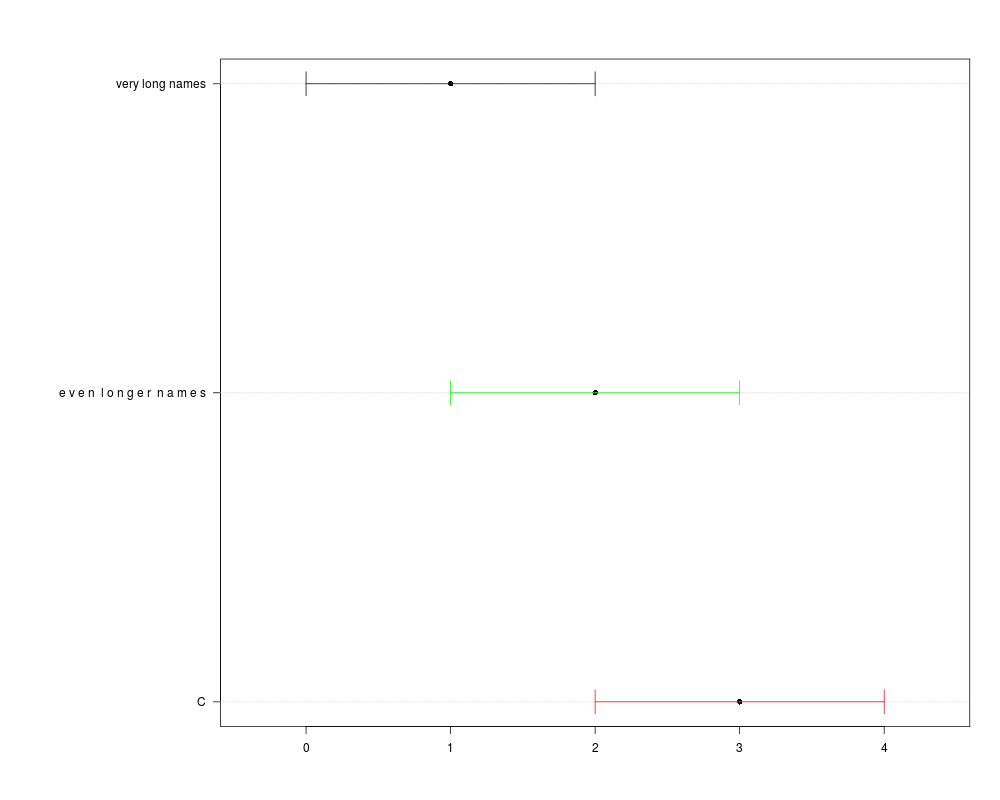
names(est)<-c("very long names",
"e v e n l o n g e r n a m e s", "C")
plotCII(estimate=est, lower=lw, upper=up,
CIcol=c("black","green","red"),
HL=TRUE
)
###########
names(est)<-c("very long names",
"e v e n l o n g e r n a m e s", "C")
plotCII(estimate=est, lower=lw, upper=up,
CIcol=c("black","green","red"),
HL=TRUE
)
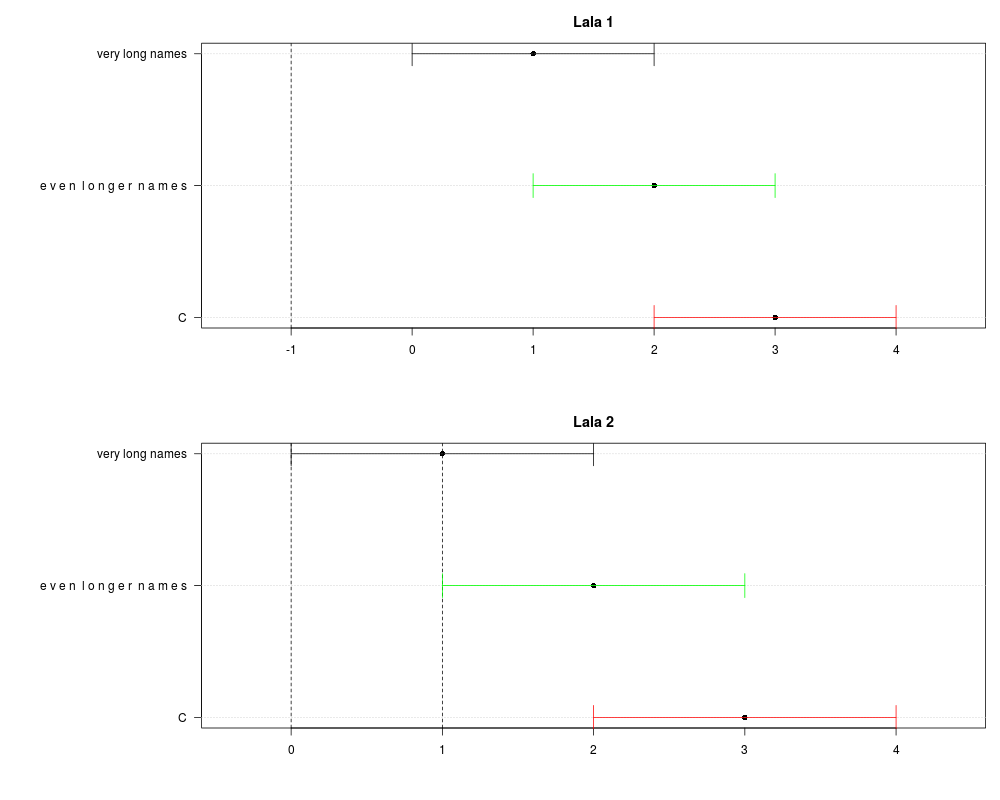
op<-par(no.readonly = TRUE)
layout(matrix(1:2, ncol=1))
par(mar=c(5,14,3,1))
plotCII(estimate=est, lower=lw, upper=up,
main="Lala 1",
CIcol=c("black","green","red"),
lines=-1,
HL=FALSE
)
plotCII(estimate=est, lower=lw, upper=up,
main="Lala 2",
CIcol=c("black","green","red"),
lines=c(0,1),
HL=FALSE
)
par(op)
Results
R version 3.3.1 (2016-06-21) -- "Bug in Your Hair"
Copyright (C) 2016 The R Foundation for Statistical Computing
Platform: x86_64-pc-linux-gnu (64-bit)

R is free software and comes with ABSOLUTELY NO WARRANTY.
You are welcome to redistribute it under certain conditions.
Type 'license()' or 'licence()' for distribution details.

R is a collaborative project with many contributors.
Type 'contributors()' for more information and
'citation()' on how to cite R or R packages in publications.

Type 'demo()' for some demos, 'help()' for on-line help, or
'help.start()' for an HTML browser interface to help.
Type 'q()' to quit R.

> library(MCPAN)
> png(filename="/home/ddbj/snapshot/RGM3/R_CC/result/MCPAN/plotCII.Rd_%03d_medium.png", width=480, height=480)
> ### Name: plotCII
> ### Title: Plot confidence intervals
> ### Aliases: plotCII
> ### Keywords: hplot
>
> ### ** Examples
>
>
>
> est<-c(1,2,3)
> names(est)<-c("A", "B", "C")
> lw=c(0,1,2)
> up=c(2,3,4)
>
> plotCII(estimate=est, lower=lw, upper=up)
>
>
> plotCII(estimate=est, lower=lw, upper=up,
+ lines=c(-1,0,1),
+ lineslty=c(3,1,3),
+ lineslwd=c(1,2,1))
>
> ###########
>
> names(est)<-c("very long names",
+  "e v e n  l o n g e r  n a m e s", "C")
>
> plotCII(estimate=est, lower=lw, upper=up,
+  CIcol=c("black","green","red"),
+  HL=TRUE
+ )
>
> ###########
>
>
> names(est)<-c("very long names",
+  "e v e n  l o n g e r  n a m e s", "C")
>
> plotCII(estimate=est, lower=lw, upper=up,
+  CIcol=c("black","green","red"),
+  HL=TRUE
+ )
>
> op<-par(no.readonly = TRUE)
>
> layout(matrix(1:2, ncol=1))
>
> par(mar=c(5,14,3,1))
>
> plotCII(estimate=est, lower=lw, upper=up,
+  main="Lala 1",
+  CIcol=c("black","green","red"),
+  lines=-1,
+  HL=FALSE
+ )
>
>
> plotCII(estimate=est, lower=lw, upper=up,
+  main="Lala 2",
+  CIcol=c("black","green","red"),
+  lines=c(0,1),
+  HL=FALSE
+ )
>
> par(op)
>
>
>
>
>
>
>
> dev.off()
null device
          1
>
 .
.