Supported by Dr. Osamu Ogasawara and  . . |
|
Last data update: 2014.03.03 |
Calculate planning quantities for MCPModDescriptionCalculates the optimal model contrasts, the critical value and the contrast correlation matrix, i.e. the quantities necessary to conduct the multiple contrast test for a given candidate set of dose-response models. Usage
planMM(models, doses, n, off = 0.1 * max(doses), scal = 1.2 * max(doses),
       std = TRUE, alpha = 0.025, twoSide = FALSE,
       control = mvtnorm.control(), cV = TRUE, muMat = NULL)
Arguments
ValueAn object of class planMM with the following components:
ReferencesBornkamp B., Pinheiro J. C., and Bretz, F. (2009). MCPMod: An R Package for the Design and Analysis of Dose-Finding Studies, Journal of Statistical Software, 29(7), 1–23 Bretz, F., Pinheiro, J., and Branson, M. (2005), Combining Multiple Comparisons and Modeling Techniques in Dose-Response Studies, Biometrics, 61, 738–748 Pinheiro, J. C., Bornkamp, B., and Bretz, F. (2006). Design and analysis of dose finding studies combining multiple comparisons and modeling procedures, Journal of Biopharmaceutical Statistics, 16, 639–656 See Also
Examples
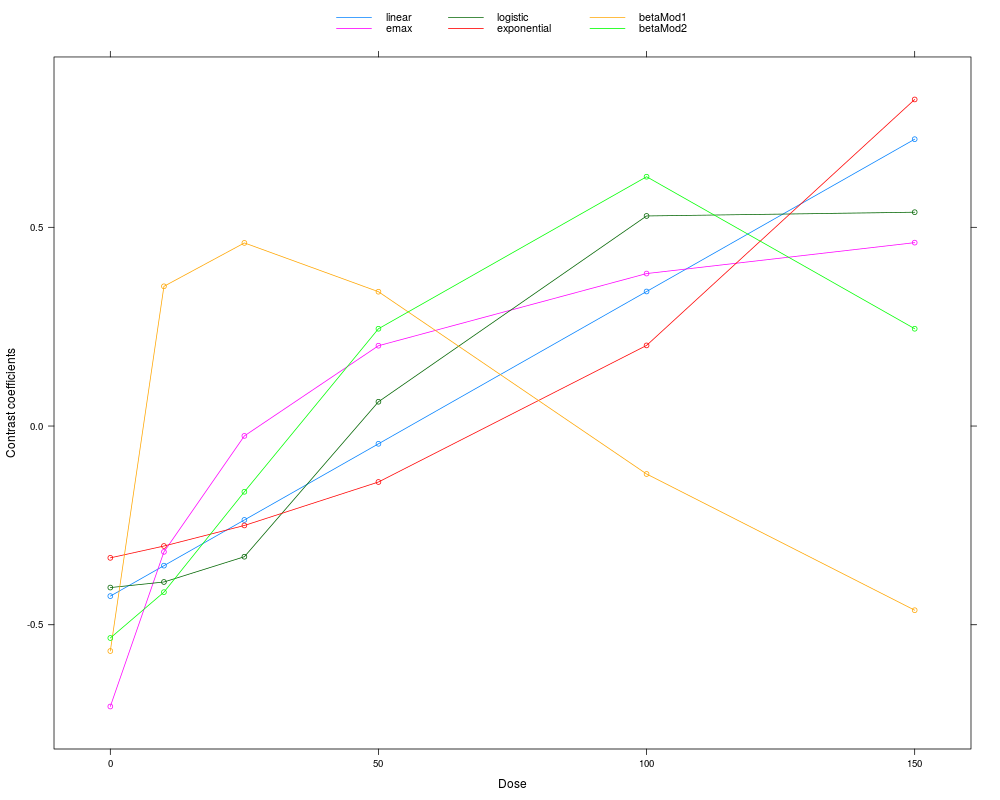
# Example from JBS paper
doses <- c(0,10,25,50,100,150)
models <- list(linear = NULL, emax = 25,
               logistic = c(50, 10.88111), exponential= 85,
               betaMod=matrix(c(0.33,2.31,1.39,1.39), byrow=TRUE, nrow=2))
plM <- planMM(models, doses, n = rep(50,6), alpha = 0.05, scal=200)
plot(plM)

## Not run:
# example, where means are directly specified
# doses
dvec <- c(0, 10, 50, 100)
# mean vectors
mu1 <- c(1, 2, 2, 2)
mu2 <- c(1, 1, 2, 2)
mu3 <- c(1, 1, 1, 2)
mMat <- cbind(mu1, mu2, mu3)
dimnames(mMat)[[1]] <- dvec
planMM(muMat = mMat, doses = dvec, n = 30)

## End(Not run)
Results
R version 3.3.1 (2016-06-21) -- "Bug in Your Hair"
Copyright (C) 2016 The R Foundation for Statistical Computing
Platform: x86_64-pc-linux-gnu (64-bit)

R is free software and comes with ABSOLUTELY NO WARRANTY.
You are welcome to redistribute it under certain conditions.
Type 'license()' or 'licence()' for distribution details.

R is a collaborative project with many contributors.
Type 'contributors()' for more information and
'citation()' on how to cite R or R packages in publications.

Type 'demo()' for some demos, 'help()' for on-line help, or
'help.start()' for an HTML browser interface to help.
Type 'q()' to quit R.

> library(MCPMod)
Loading required package: mvtnorm
Loading required package: lattice
> png(filename="/home/ddbj/snapshot/RGM3/R_CC/result/MCPMod/planMM.Rd_%03d_medium.png", width=480, height=480)
> ### Name: planMM
> ### Title: Calculate planning quantities for MCPMod
> ### Aliases: planMM print.planMM
> ### Keywords: design
>
> ### ** Examples
>
> # Example from JBS paper
> doses <- c(0,10,25,50,100,150)
> models <- list(linear = NULL, emax = 25,
+                logistic = c(50, 10.88111), exponential= 85,
+                betaMod=matrix(c(0.33,2.31,1.39,1.39), byrow=TRUE, nrow=2))
> plM <- planMM(models, doses, n = rep(50,6), alpha = 0.05, scal=200)
> plot(plM)
>
> ## Not run:
> ##D # example, where means are directly specified
> ##D # doses
> ##D dvec <- c(0, 10, 50, 100)
> ##D # mean vectors
> ##D mu1 <- c(1, 2, 2, 2)
> ##D mu2 <- c(1, 1, 2, 2)
> ##D mu3 <- c(1, 1, 1, 2)
> ##D mMat <- cbind(mu1, mu2, mu3)
> ##D dimnames(mMat)[[1]] <- dvec
> ##D planMM(muMat = mMat, doses = dvec, n = 30)
> ## End(Not run)
>
>
>
>
>
> dev.off()
null device
          1
>
|