Supported by Dr. Osamu Ogasawara and  . . |
|
Last data update: 2014.03.03 |
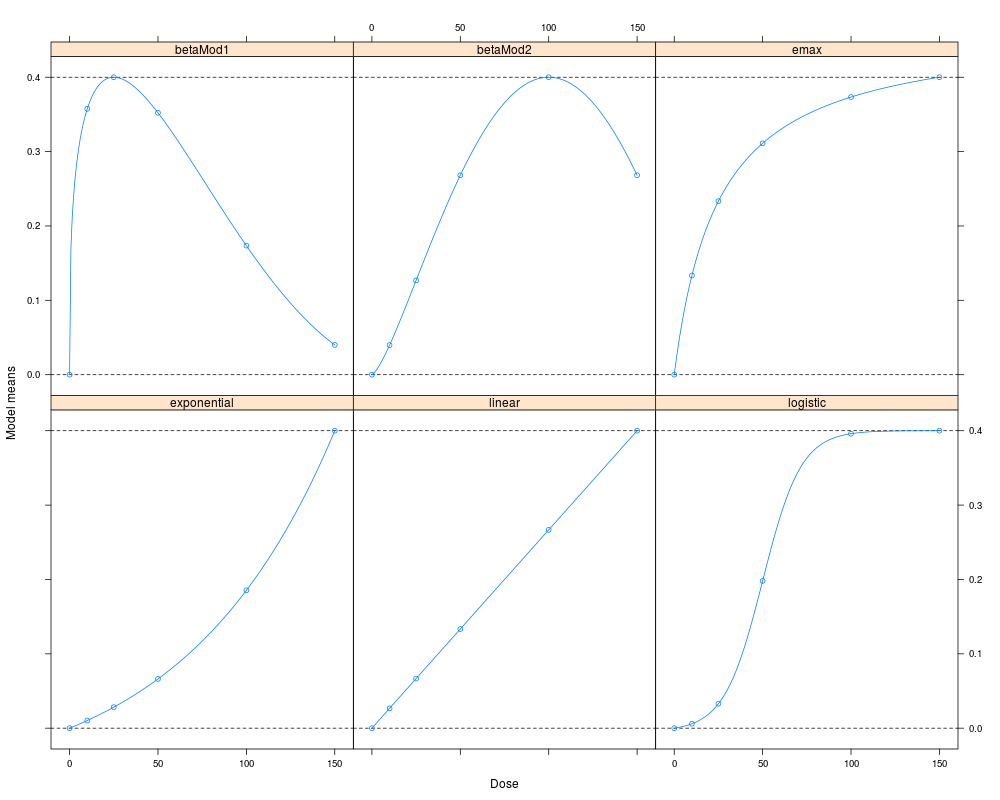
Plot candidate modelsDescriptionProduces a trellis display of the model functions in the candidate set. The location
and scale parameters of the models are determined by the Usage
plotModels(models, doses, base, maxEff, nPoints = 200,
           off = 0.1 * max(doses), scal = 1.2 * max(doses),
           superpose = FALSE, ylab = "Model means",
           xlab = "Dose", ...)
Arguments
ReferencesBornkamp B., Pinheiro J. C., Bretz, F. (2009). MCPMod: An R Package for the Design and Analysis of Dose-Finding Studies, Journal of Statistical Software, 29(7), 1–23 Pinheiro, J. C., Bornkamp, B. and Bretz, F. (2006). Design and analysis of dose finding studies combining multiple comparisons and modeling procedures, Journal of Biopharmaceutical Statistics, 16, 639–656 See Also
Examples
# JBS example
doses <- c(0,10,25,50,100,150)
models <- list(linear = NULL, emax = c(25),
logistic = c(50, 10.88111), exponential = c(85),
betaMod = matrix(c(0.33, 2.31, 1.39, 1.39),
byrow=TRUE, nrow=2))
plotModels(models, doses, base = 0, maxEff = 0.4, scal = 200)
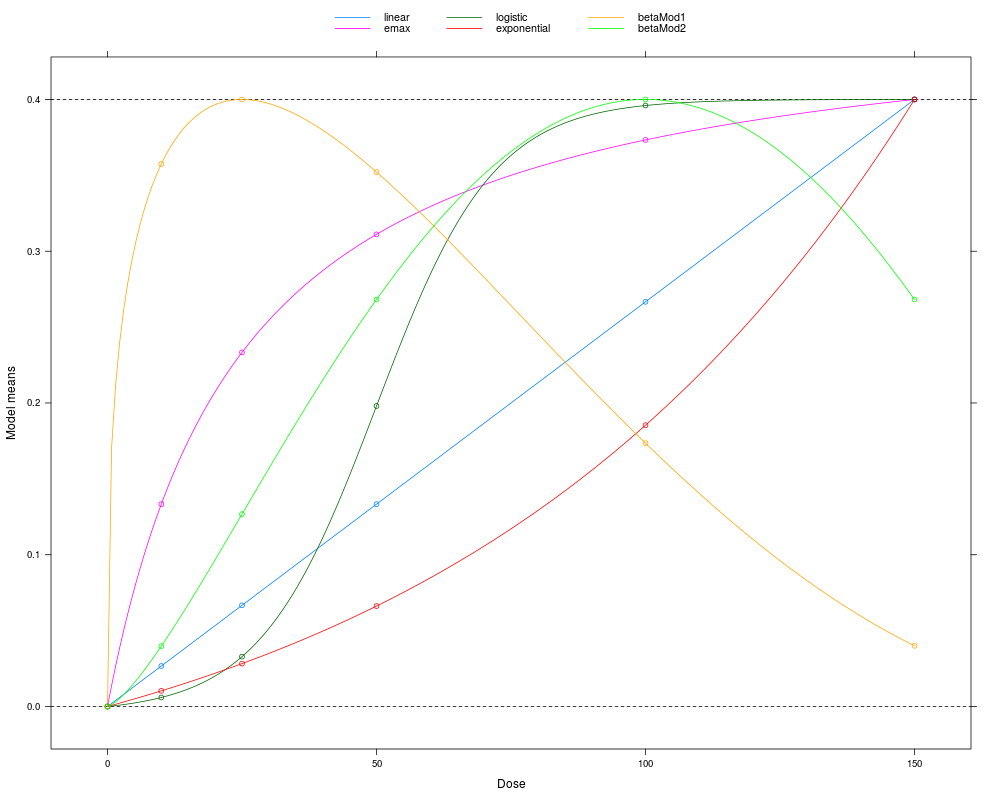
# all models in one panel
plotModels(models, doses, base = 0, maxEff = 0.4, scal = 200,
superpose = TRUE)
# plotModels can also be called using a fullMod object
fM <- fullMod(models, doses, base = 0, maxEff = 0.4, scal = 200)
plotModels(fM)
# or even easier
plot(fM)
Results
R version 3.3.1 (2016-06-21) -- "Bug in Your Hair"
Copyright (C) 2016 The R Foundation for Statistical Computing
Platform: x86_64-pc-linux-gnu (64-bit)

R is free software and comes with ABSOLUTELY NO WARRANTY.
You are welcome to redistribute it under certain conditions.
Type 'license()' or 'licence()' for distribution details.

R is a collaborative project with many contributors.
Type 'contributors()' for more information and
'citation()' on how to cite R or R packages in publications.

Type 'demo()' for some demos, 'help()' for on-line help, or
'help.start()' for an HTML browser interface to help.
Type 'q()' to quit R.

> library(MCPMod)
Loading required package: mvtnorm
Loading required package: lattice
> png(filename="/home/ddbj/snapshot/RGM3/R_CC/result/MCPMod/plotModels.Rd_%03d_medium.png", width=480, height=480)
> ### Name: plotModels
> ### Title: Plot candidate models
> ### Aliases: plotModels
> ### Keywords: hplot
>
> ### ** Examples
>
> # JBS example
> doses <- c(0,10,25,50,100,150)
> models <- list(linear = NULL, emax = c(25),
+             logistic = c(50, 10.88111), exponential = c(85),
+             betaMod = matrix(c(0.33, 2.31, 1.39, 1.39),
+              byrow=TRUE, nrow=2))
> plotModels(models, doses, base = 0, maxEff = 0.4, scal = 200)
> # all models in one panel
> plotModels(models, doses, base = 0, maxEff = 0.4, scal = 200,
+            superpose = TRUE)
>
> # plotModels can also be called using a fullMod object
> fM <- fullMod(models, doses, base = 0, maxEff = 0.4, scal = 200)
> plotModels(fM)
> # or even easier
> plot(fM)
>
>
>
>
>
> dev.off()
null device
          1
>
|