Supported by Dr. Osamu Ogasawara and  . . |
|
Last data update: 2014.03.03 |
A function to perform MDR on a dataset using the three-way split for internal validation.DescriptionDetermines the best MDR model up to a specified size of interaction Usagemdr.3WS(data, K, x = NULL, proportion = NULL, ratio = NULL, equal = "HR", genotype = c(0, 1, 2)) Arguments
DetailsMDR is a non-parametric data-mining approach to variable selection designed to detect gene-gene or gene-environment interactions in case-control studies. This function uses balanced accuracy as the evaluation measure to rank potential models. An overall best model is chosen to minimize balanced accuracy, while also preventing model over-fitting with internal validation. This function uses a three-way split of the data (training set for model building, testing set for replication, and validation set for prediction) for internal validation. ValueAn object of class
... WarningMDR is a combinatorial search approach, so considering high-order interactions (i.e. large values for Note When determining the high-risk/low-risk status of a genotype combination, the order of combinations uses the convention that the genotypes of the first locus vary the most, based on the function Author(s)Stacey Winham ReferencesRitchie et al (2001). Multifactor-dimensionality reduction reveals high-order interactions among estrogen-metabolism genes in sporadic breast cancer. Am J Hm Genet 69, 138-147. Velez et al (2007). A balanced accuracy function for epistasis modeling in imbalanced datasets using multifactor dimensionality reduction. Genet Epidemiol 31, 306-315. Winham SJ and Motsinger AA (2010). A comparison of internal validation techniques for multifactor dimensionality reduction. BMC Bioinformatics. See Also
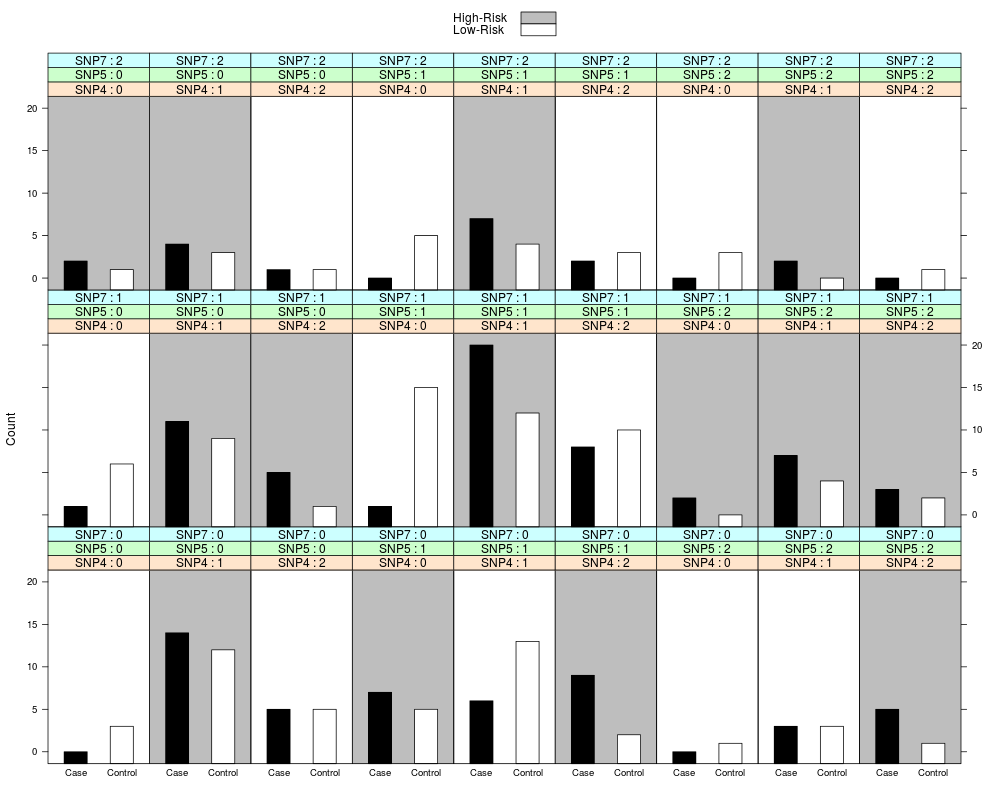
Examples#load test data data(mdr1) fit<-mdr.3WS(data=mdr1[,1:11], K=3, x = NULL, proportion = NULL, ratio = NULL, equal = "HR", genotype = c(0, 1, 2)) #fit MDR with 3WS to a subset of the sample data, allowing for 1 to 3-way interactions print(fit) #view the fitted mdr object summary(fit) #create summary table of best MDR model plot(fit, data=mdr1) #create contingency plot of best MDR model; may need to expand the plot window for large values of K Results
R version 3.3.1 (2016-06-21) -- "Bug in Your Hair"
Copyright (C) 2016 The R Foundation for Statistical Computing
Platform: x86_64-pc-linux-gnu (64-bit)

R is free software and comes with ABSOLUTELY NO WARRANTY.
You are welcome to redistribute it under certain conditions.
Type 'license()' or 'licence()' for distribution details.

R is a collaborative project with many contributors.
Type 'contributors()' for more information and
'citation()' on how to cite R or R packages in publications.

Type 'demo()' for some demos, 'help()' for on-line help, or
'help.start()' for an HTML browser interface to help.
Type 'q()' to quit R.

> library(MDR)
Loading required package: lattice
> png(filename="/home/ddbj/snapshot/RGM3/R_CC/result/MDR/mdr.3WS.Rd_%03d_medium.png", width=480, height=480)
> ### Name: mdr.3WS
> ### Title: A function to perform MDR on a dataset using the three-way split
> ###   for internal validation.
> ### Aliases: mdr.3WS
>
> ### ** Examples
>
> #load test data
> data(mdr1)
>
> fit<-mdr.3WS(data=mdr1[,1:11], K=3, x = NULL, proportion = NULL, ratio = NULL, equal = "HR", genotype = c(0, 1, 2)) #fit MDR with 3WS to a subset of the sample data, allowing for 1 to 3-way interactions
>
> print(fit) #view the fitted mdr object
$`final model`
[1] 4 6 8

$`final model accuracy`
[1] 66.25616

$`top models`
$`top models`[[1]]
[1] 9

$`top models`[[2]]
[1] 4 9

$`top models`[[3]]
[1] 4 6 8


$`top model accuracies`
     training accuracy testing accuracy prediction accuracy
[1,]          61.66198         60.92437            61.90476
[2,]          68.36612         69.36775            65.59934
[3,]          73.90606         74.26971            66.25616

$`high-risk/low-risk`
 [1]  0  1  0  0  1  1  0  1  0  0  1  1  0  0  1  1  1  1 NA  1  0 NA  1  0 NA
[26]  0  1

$genotypes
[1] 0 1 2

$`validation method`
[1] "3WS"

attr(,"class")
[1] "mdr"
>
> summary(fit) #create summary table of best MDR model
  Level    Best Models        Training Accuracy    Testing Accuracy
      1              9                    61.66               60.92
      2              4 9                  68.37               69.37
*     3              4 6 8                73.91               74.27
     Validation Accuracy
                   61.90
                   65.60
*                  66.26

'*' indicates overall best model>
> plot(fit, data=mdr1) #create contingency plot of best MDR model; may need to expand the plot window for large values of K
>
>
>
>
>
>
> dev.off()
null device
          1
>
|