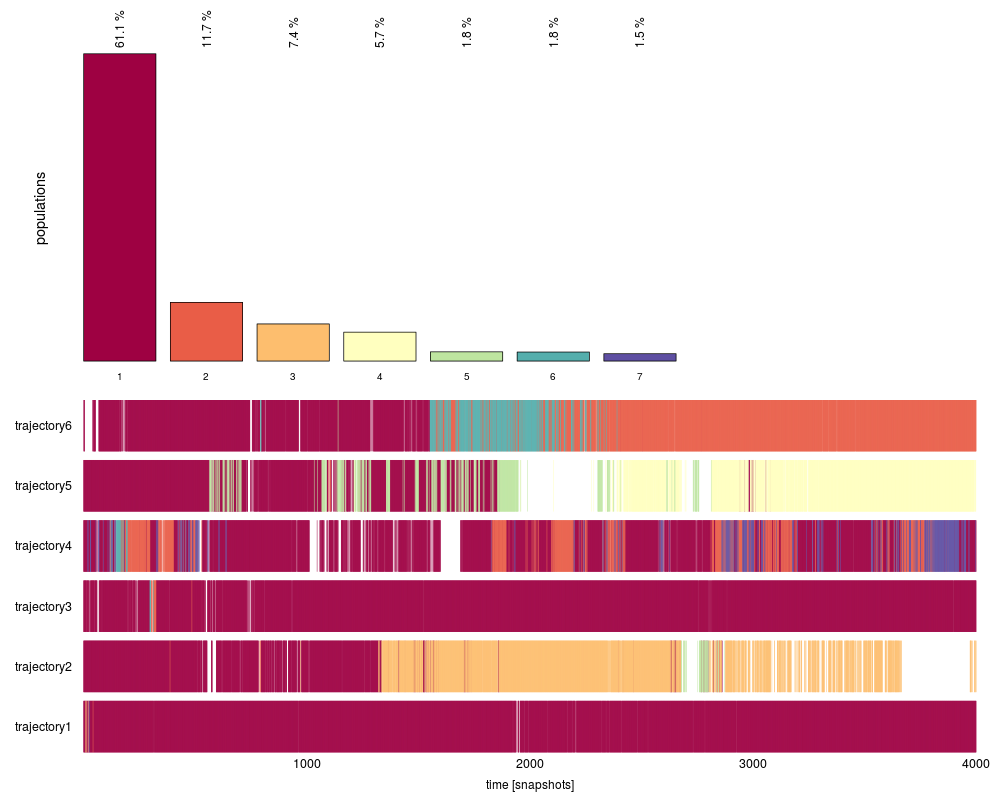
This function plots distributions between clusters over time. In the top sub-plot, the overall distribution is given, while the timeseries is given at the bottom. The clusters are sorted beginning with the most populated one and then in descending order. Selections can be made, clusters that are not selected do also not appear in the timeseries plot (white areas).
List of cluster information as provided by load_clusters_ts(), the associated loading function.
clustersNumber
Integer, specifying the number of clusters that is to be plotted.
selectTraj
Vector of indices of trajectories that are to be plotted (as given in the input file).
selectTime
Range of time in snapshots, which is to be plotted.
timeUnit
Abbreviation of time unit.
snapshotsPerTimeInt
Specifies, how many snapshots make up one time unit.
...
Additional arguments (ellipsis).
Author(s)
Christian Margreitter
Examples
# see "extdata/clusters_ts_example.txt.gz" for format information
clusters_ts( load_clusters_ts( system.file( "extdata/clusters_ts_example.txt.gz",
                               package = "MDplot" ),
                               lengths = c( 4000, 4000, 4000, 4000, 4000, 4000 ) ),
             clustersNumber = 7 )
Results
R version 3.3.1 (2016-06-21) -- "Bug in Your Hair"
Copyright (C) 2016 The R Foundation for Statistical Computing
Platform: x86_64-pc-linux-gnu (64-bit)

R is free software and comes with ABSOLUTELY NO WARRANTY.
You are welcome to redistribute it under certain conditions.
Type 'license()' or 'licence()' for distribution details.

R is a collaborative project with many contributors.
Type 'contributors()' for more information and
'citation()' on how to cite R or R packages in publications.

Type 'demo()' for some demos, 'help()' for on-line help, or
'help.start()' for an HTML browser interface to help.
Type 'q()' to quit R.

> library(MDplot)
Loading required package: MASS
Loading required package: RColorBrewer
Loading required package: gplots

Attaching package: 'gplots'

The following object is masked from 'package:stats':

    lowess

Loading required package: gtools
> png(filename="/home/ddbj/snapshot/RGM3/R_CC/result/MDplot/clusters_ts.Rd_%03d_medium.png", width=480, height=480)
> ### Name: clusters_ts
> ### Title: Cluster timeseries plot
> ### Aliases: clusters_ts
> ### Keywords: clusters_ts
>
> ### ** Examples
>
> # see "extdata/clusters_ts_example.txt.gz" for format information
> clusters_ts( load_clusters_ts( system.file( "extdata/clusters_ts_example.txt.gz",
+                                package = "MDplot" ),
+                                lengths = c( 4000, 4000, 4000, 4000, 4000, 4000 ) ),
+              clustersNumber = 7 )
            cluster1 cluster2 cluster3 cluster4 cluster5 cluster6 cluster7
overall        61.05    11.66     7.38     5.74     1.84     1.80     1.47
trajectory1    99.10     0.02     0.05     0.02     0.00     0.00     0.02
trajectory2    33.23     0.10    44.22     0.00     1.12     0.00     0.00
trajectory3    97.32     0.48     0.00     0.00     0.00     0.12     0.00
trajectory4    62.82    18.52     0.00     0.00     0.00     0.73     8.77
trajectory5    38.12     0.10     0.00    34.42     9.88     0.00     0.00
trajectory6    35.70    50.75     0.00     0.00     0.02     9.95     0.00
>
>
>
>
>
> dev.off()
null device
          1
>
 .
.