R: DSSP timeseries plot for secondary structure elements...
dssp_ts
R Documentation
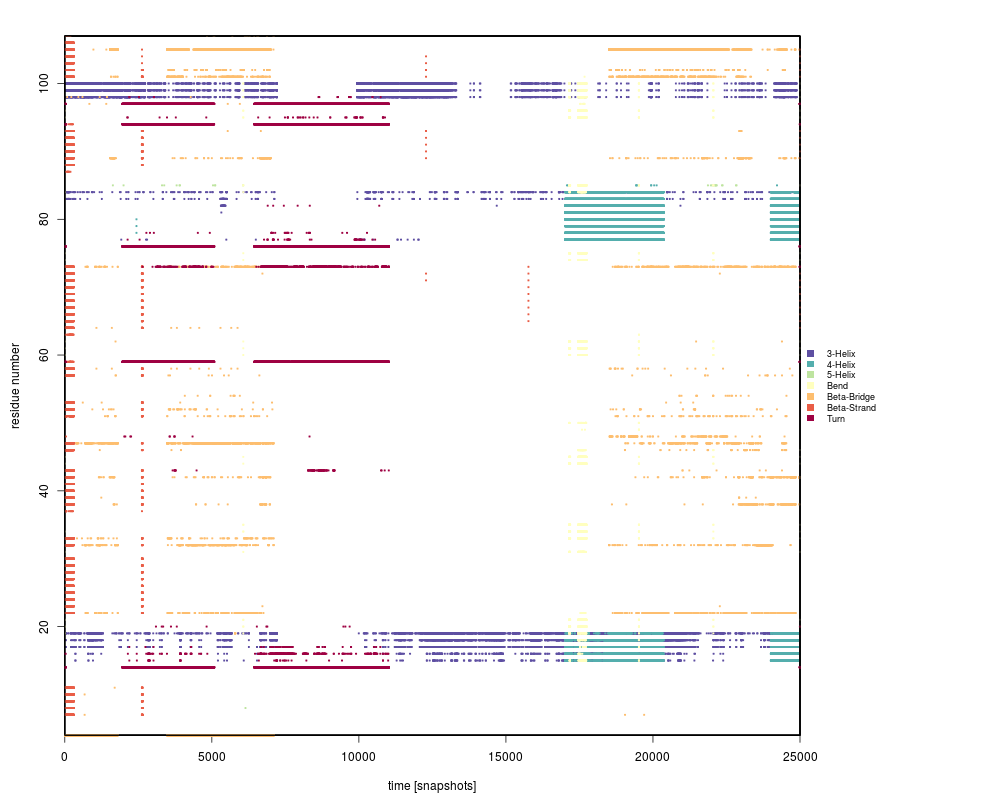
DSSP timeseries plot for secondary structure elements (proteins)
Description
Plots time-series for secondary structure motifs in the context of the widely used dssp algorithm. The default order is: "3-Helix", "4-Helix", "5-Helix", "Bend", "Beta-Bridge", "Beta-Strand", "Turn".
List consisting of lists, which are composed of a name (string) and a values table (x ... snapshots, y ... residues). Can be generated by load_dssp_ts().
printLegend
If TRUE, a legend is printed on the right hand side of the plot.
timeBoundaries
A vector of boundaries for the time in snapshots.
residueBoundaries
A vector of boundaries for the residues.
timeUnit
If set, the snapshots are transformed into the respective time (depending on parameter snapshotsPerTime.
snapshotsPerTimeInt
Number of snapshots per respective timeUnit.
barePlot
Boolean, indicating whether the plot is to be made without any additional information.
R version 3.3.1 (2016-06-21) -- "Bug in Your Hair"
Copyright (C) 2016 The R Foundation for Statistical Computing
Platform: x86_64-pc-linux-gnu (64-bit)

R is free software and comes with ABSOLUTELY NO WARRANTY.
You are welcome to redistribute it under certain conditions.
Type 'license()' or 'licence()' for distribution details.

R is a collaborative project with many contributors.
Type 'contributors()' for more information and
'citation()' on how to cite R or R packages in publications.

Type 'demo()' for some demos, 'help()' for on-line help, or
'help.start()' for an HTML browser interface to help.
Type 'q()' to quit R.

> library(MDplot)
Loading required package: MASS
Loading required package: RColorBrewer
Loading required package: gplots

Attaching package: 'gplots'

The following object is masked from 'package:stats':

    lowess

Loading required package: gtools
> png(filename="/home/ddbj/snapshot/RGM3/R_CC/result/MDplot/dssp_ts.Rd_%03d_medium.png", width=480, height=480)
> ### Name: dssp_ts
> ### Title: DSSP timeseries plot for secondary structure elements (proteins)
> ### Aliases: dssp_ts
> ### Keywords: dssp
>
> ### ** Examples
>
> dssp_ts( load_dssp_ts( system.file( "extdata", package = "MDplot" ) ) )
>
>
>
>
>
> dev.off()
null device
          1
>
 .
.