Supported by Dr. Osamu Ogasawara and  . . |
|
Last data update: 2014.03.03 |
ROC analysisDescriptionPerform a ROC analysis on a continuous variable for identifying a binary outcome. Usage
## S4 method for signature 'MRIaggr'
calcROCthreshold(object, param, mask, plot = "ROC_Youden", digit = 10,
         filename = paste(object@identifier, "calcROCthreshold", plot, sep = "_"),
         update.object = FALSE, overwrite = FALSE, ...)
Arguments
DetailsThis function requires to have installed the ROCR package to work. ARGUMENTS: Possible values for
ValueAn data.frame containing for each mask the AUC and AUPRC value, the optimal threshold and the corresponding sensitivity and specificity for the Youden criteria and a utility function taking into account the prevalence. See Also
Examples
## load a MRIaggr object
data("MRIaggr.Pat1_red", package = "MRIaggr")
## ROC analysis
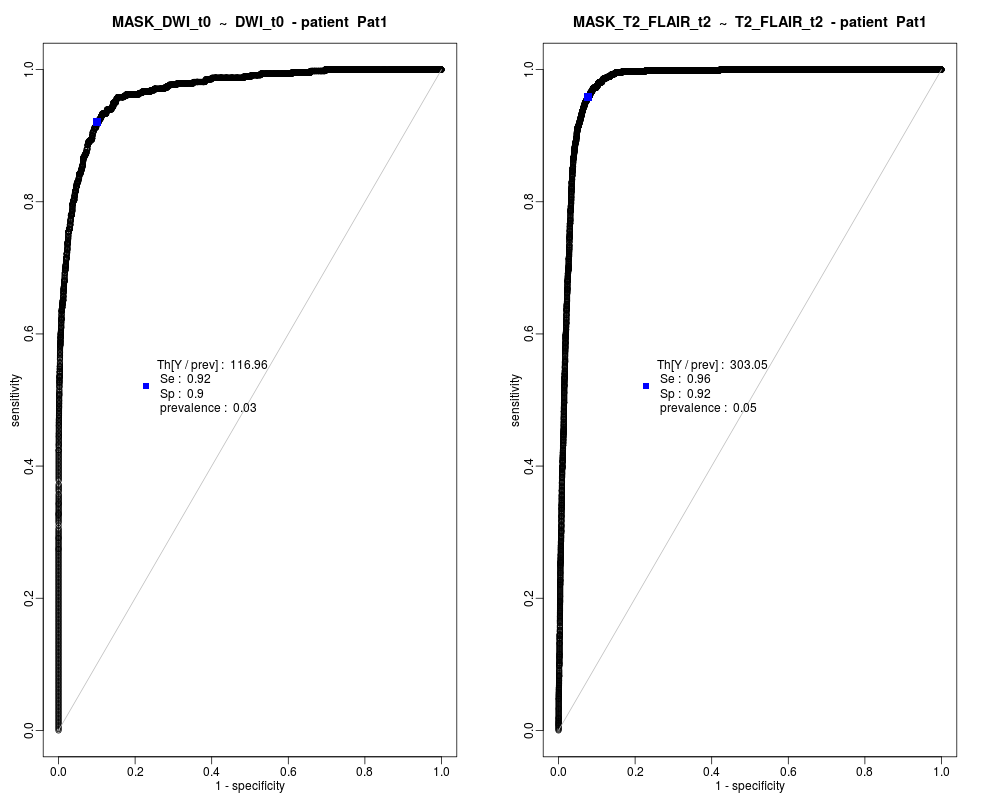
res <- calcROCthreshold(MRIaggr.Pat1_red, param = c("DWI_t0","T2_FLAIR_t2"),
mask = c("MASK_DWI_t0","MASK_T2_FLAIR_t2"), numeric2logical = TRUE)
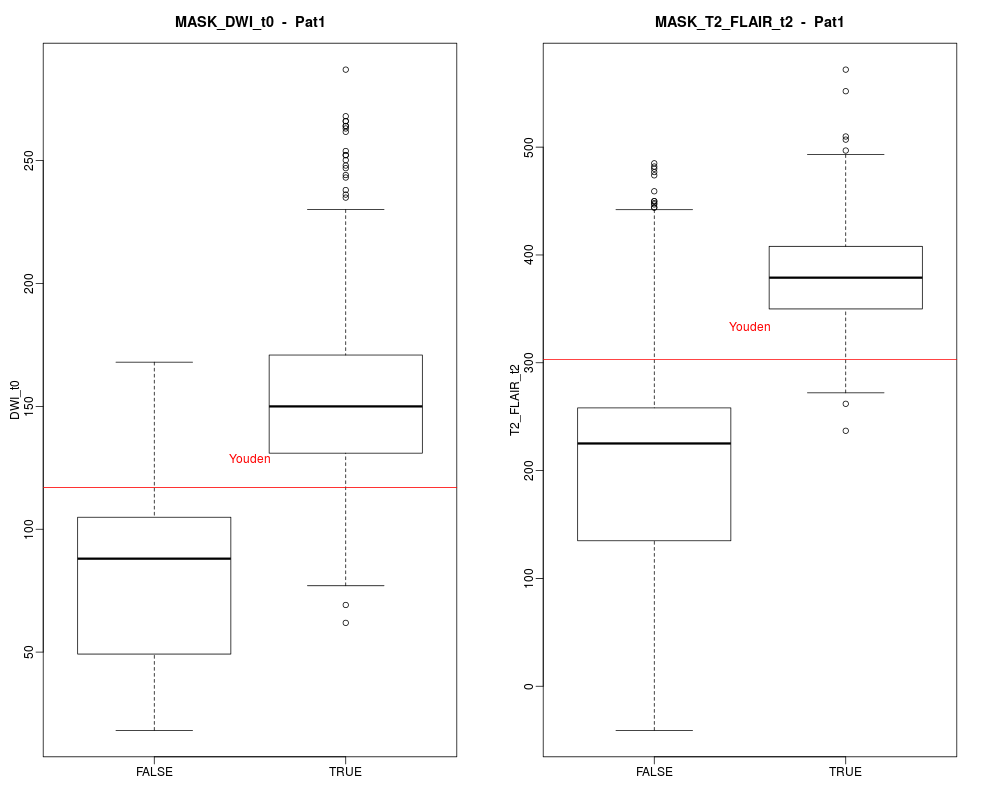
res <- calcROCthreshold(MRIaggr.Pat1_red, param = c("DWI_t0","T2_FLAIR_t2"),
mask = c("MASK_DWI_t0","MASK_T2_FLAIR_t2"), numeric2logical = TRUE,
plot = "boxplot_Youden",
update.object = TRUE, overwrite = TRUE)
selectDescStats(MRIaggr.Pat1_red, "Mask_threshold")
Results
R version 3.3.1 (2016-06-21) -- "Bug in Your Hair"
Copyright (C) 2016 The R Foundation for Statistical Computing
Platform: x86_64-pc-linux-gnu (64-bit)

R is free software and comes with ABSOLUTELY NO WARRANTY.
You are welcome to redistribute it under certain conditions.
Type 'license()' or 'licence()' for distribution details.

R is a collaborative project with many contributors.
Type 'contributors()' for more information and
'citation()' on how to cite R or R packages in publications.

Type 'demo()' for some demos, 'help()' for on-line help, or
'help.start()' for an HTML browser interface to help.
Type 'q()' to quit R.

> library(MRIaggr)
Loading required package: Rcpp
> png(filename="/home/ddbj/snapshot/RGM3/R_CC/result/MRIaggr/MRIaggr-calcROCthreshold.Rd_%03d_medium.png", width=480, height=480)
> ### Name: calcROCthreshold
> ### Title: ROC analysis
> ### Aliases: calcROCthreshold calcROCthreshold,MRIaggr-method
> ### Keywords: methods
>
> ### ** Examples
>
> ## load a MRIaggr object
> data("MRIaggr.Pat1_red", package = "MRIaggr")
>
> ## ROC analysis
> res <- calcROCthreshold(MRIaggr.Pat1_red, param = c("DWI_t0","T2_FLAIR_t2"),
+                         mask = c("MASK_DWI_t0","MASK_T2_FLAIR_t2"), numeric2logical = TRUE)
>
> res <- calcROCthreshold(MRIaggr.Pat1_red, param = c("DWI_t0","T2_FLAIR_t2"),
+                         mask = c("MASK_DWI_t0","MASK_T2_FLAIR_t2"), numeric2logical = TRUE,
+                         plot = "boxplot_Youden",
+ 						update.object = TRUE, overwrite = TRUE)
allocDescStats[MRIaggr] : Element "Mask_threshold"
                          has been allocated
>
> selectDescStats(MRIaggr.Pat1_red, "Mask_threshold")
              mask       param       AUC     AUPRC OptTh_Youden Se_Youden
1      MASK_DWI_t0      DWI_t0 0.9673375 0.7499567       116.96 0.9209979
2 MASK_T2_FLAIR_t2 T2_FLAIR_t2 0.9777676 0.6449005       303.05 0.9589041
  Sp_Youden OptTh_prev   Se_prev   Sp_prev
1 0.8991869     144.04 0.5800416 0.9959343
2 0.9236553     370.03 0.5931507 0.9817387
>
>
>
>
>
> dev.off()
null device
          1
>
|