Supported by Dr. Osamu Ogasawara and  . . |
|
Last data update: 2014.03.03 |
Analyze CG methylationDescriptionFunction to determine percent methylation for all CGs from input fragmentation Usage
analyzeCpGs(fragments, peaks, method = c("weighted", "proportion"))
Arguments
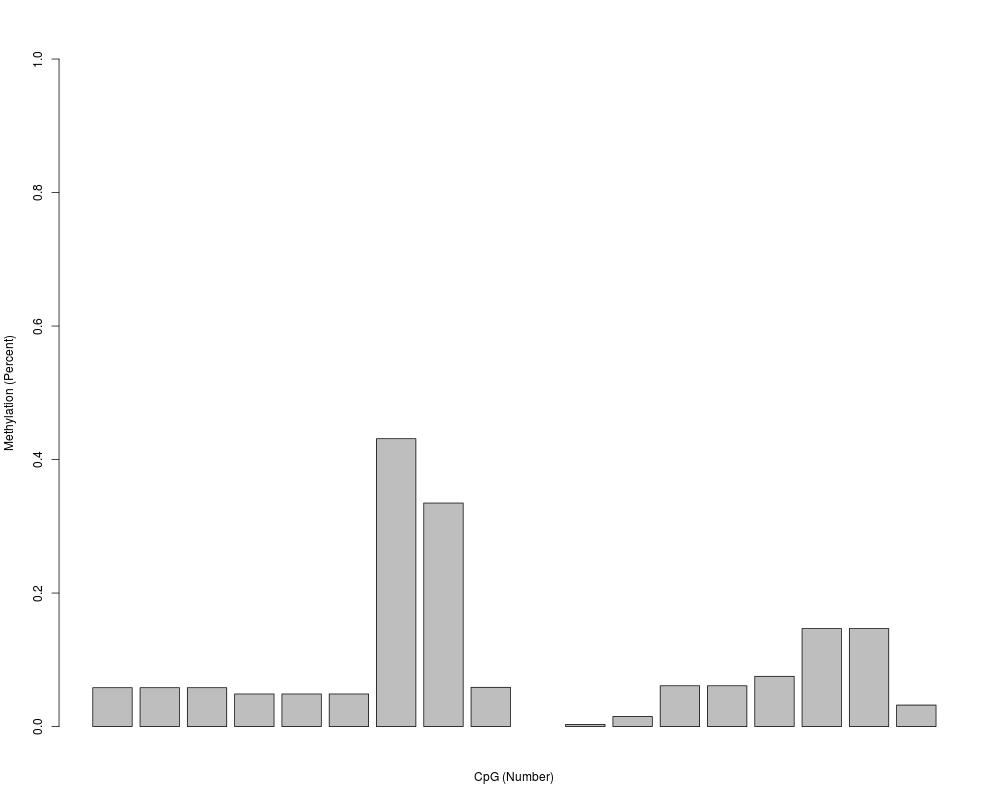
DetailsWrapper function for ValueReturns a list of numerical values corresponding to percent methylation for each CG dinucleotide, with 0 Author(s)Reid F. Thompson (rthompso@aecom.yu.edu), John M. Greally (jgreally@aecom.yu.edu) See Also See Also Examplesdata(MassArray.example.data) cpg.data <- analyzeCpGs(MassArray.example.data$fragments.T, MassArray.example.data$samples[[1]]$peaks, method="weighted") barplot(cpg.data, xlab="CpG (Number)", ylim=c(0,1), ylab="Methylation (Percent)") Results
R version 3.3.1 (2016-06-21) -- "Bug in Your Hair"
Copyright (C) 2016 The R Foundation for Statistical Computing
Platform: x86_64-pc-linux-gnu (64-bit)

R is free software and comes with ABSOLUTELY NO WARRANTY.
You are welcome to redistribute it under certain conditions.
Type 'license()' or 'licence()' for distribution details.

R is a collaborative project with many contributors.
Type 'contributors()' for more information and
'citation()' on how to cite R or R packages in publications.

Type 'demo()' for some demos, 'help()' for on-line help, or
'help.start()' for an HTML browser interface to help.
Type 'q()' to quit R.

> library(MassArray)
> png(filename="/home/ddbj/snapshot/RGM3/R_BC/result/MassArray/analyzeCpGs.Rd_%03d_medium.png", width=480, height=480)
> ### Name: analyzeCpGs
> ### Title: Analyze CG methylation
> ### Aliases: analyzeCpGs
> ### Keywords: attribute arith
>
> ### ** Examples
>
> data(MassArray.example.data)
> cpg.data <- analyzeCpGs(MassArray.example.data$fragments.T, MassArray.example.data$samples[[1]]$peaks, method="weighted")
> barplot(cpg.data, xlab="CpG (Number)", ylim=c(0,1), ylab="Methylation (Percent)")
>
>
>
>
>
> dev.off()
null device
          1
>
|
Created & Maintained by Osamu Ogasawara (osamu.ogasawara@gmail.com) and 